In prospect theory, the value function is typically concave for gains and convex for losses, with losses usually having a steeper slope than gains. The neural system responds differently to losses and gains. Five new studies on neurons related to this issue have examined neuronal responses to losses, gains, and reference points. This study investigated a new concept of the value function. A value function with a neuronal cusp may exhibit variations and behavioral cusps associated with catastrophic events, potentially influencing a trader's decision to close a position. Additionally, we have conducted empirical studies on algorithmic trading strategies that employ different value function specifications.
Citation: Kazuo Sano. New concept for the value function of prospect theory[J]. Quantitative Finance and Economics, 2024, 8(4): 733-756. doi: 10.3934/QFE.2024028
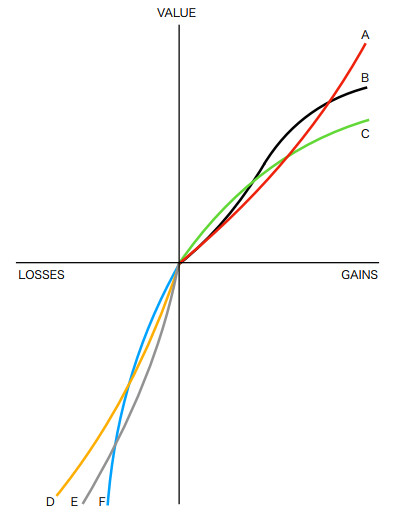
In prospect theory, the value function is typically concave for gains and convex for losses, with losses usually having a steeper slope than gains. The neural system responds differently to losses and gains. Five new studies on neurons related to this issue have examined neuronal responses to losses, gains, and reference points. This study investigated a new concept of the value function. A value function with a neuronal cusp may exhibit variations and behavioral cusps associated with catastrophic events, potentially influencing a trader's decision to close a position. Additionally, we have conducted empirical studies on algorithmic trading strategies that employ different value function specifications.

| [1] |
Anderson D, Adolphs R (2014) A framework for studying emotions across species. Cell 157: 187–200. https://doi.org/10.1016/j.cell.2014.03.003 doi: 10.1016/j.cell.2014.03.003

|
| [2] | Andreoni J, Kuhn M, Sprenger C (2015) Measuring time preferences: A comparison of experimental methods. J Econ Behav Organ 116: 451–464. Available from: https://www.sciencedirect.com/science/article/pii/S0167268115001535. |
| [3] |
Ariely D, Huber J, Wertenbroch K (2005) When do losses loom larger than gains? J Market Res 42: 134–138. https://doi.org/10.1509/jmkr.42.2.134.62283 doi: 10.1509/jmkr.42.2.134.62283
|
| [4] |
Barnik J, Vosvrda M (2009) Can a stochastic cusp catastrophe model explain stock market crashes? J Econ Dyn Control 33: 1824–1836. https://doi.org/10.1016/j.jedc.2009.04.004 doi: 10.1016/j.jedc.2009.04.004
|
| [5] |
Bechara A, Damasio AR, Damasio H, et al. (1994) Insensitivity to future consequences following damage to human prefrontal cortex. Cognition 50: 7–15. https://doi.org/10.1016/0010-0277(94)90018-3 doi: 10.1016/0010-0277(94)90018-3
|
| [6] |
Blavatskyy P (2021) A simple non-parametric method for eliciting prospect theory's value function and measuring loss aversion under risk and ambiguity. Theor Decis 91: 403–416. https://doi.org/10.1007/s11238-021-09811-6 doi: 10.1007/s11238-021-09811-6
|
| [7] |
Bosch S, Fuqua R (2001) Behavioral cusps: A model for selecting target behaviors. J Appl Behav Anal 34: 123–125. https://doi.org/10.1901/jaba.2001.34-123 doi: 10.1901/jaba.2001.34-123
|
| [8] |
Bosch S, Hixson M (2004) The final piece to a complete science of behavior: Behavior development and behavioral cusps. Behav Anal Today 5: 244–254. https://doi.org/10.1037/h0100033 doi: 10.1037/h0100033
|
| [9] | Camerer C (2004) Prospect theory in the wild: evidence from the field. Adv Behav Econ, 148–161. https://doi.org/10.1515/9781400829118-008 |
| [10] | Chen D, Lin F, Chen XJ, et al. (2014) Cusp Catastrophe Model: A Nonlinear Model for Health Outcomes in Nursing Research. Methods 63: 211–200. https://dx.doi.org/10.1097/NNR.0000000000000034 |
| [11] | Cohen J, Ericson K, Laibson D. et al. (2020) Measuring Time Preferences. J Econ Literature 58: 299–347. Available from: https://www.aeaweb.org/articles?id = 10.1257/jel.20191074. |
| [12] | de Waal F (2009) The age of empathy : nature's lessons for a kinder society, Three Rivers. |
| [13] |
Ferrari-Toniolo S, Schultz W (2023) Reliable population code for subjective economic value from heterogeneous neuronal signals in primate orbitofrontal cortex. Neuron 111: 3683–3696.e7. https://doi.org/10.1016/j.neuron.2023.08.009 doi: 10.1016/j.neuron.2023.08.009
|
| [14] |
Goyal P, Guputa P, Yadav V (2021) Antecedents to heuristics: decoding the role of herding and prospect theory for Indian millennial investors. Rev Behav Financ 15: 79–102. http://dx.doi.org/10.1108/RBF-04-2021-0073 doi: 10.1108/RBF-04-2021-0073
|
| [15] |
Graham L, Snower D (2013) Hyperbolic discounting and positive optimal inflation. Macroecon Dyn 17: 591–620. https://doi.org/10.1017/S1365100511000393 doi: 10.1017/S1365100511000393
|
| [16] |
Grasman R, van der Maas HL, Wagenmakers EJ (2009) Fitting the Cusp Catastrophe in R: A cusp Package Primer. J Stat Softw 32: 1–27. https://doi.org/10.18637/jss.v032.i08 doi: 10.18637/jss.v032.i08
|
| [17] |
Haigh M, List J (2005) Do professional traders exhibit myopic loss aversion? an experimental analysis. J Financ 60: 523–534. https://doi.org/10.1111/j.1540-6261.2005.00737.x doi: 10.1111/j.1540-6261.2005.00737.x
|
| [18] |
Harinck F, Dijk E, Beest I, et al. (2007) When gains loom larger than losses: reversed loss aversion for small amounts of money. Psychol Sci 18: 1099-1105. https://doi.org/10.1111/j.1467-9280.2007.02031.x doi: 10.1111/j.1467-9280.2007.02031.x
|
| [19] |
Imaizumi Y, Tymula A, Tsubo Y, et al. (2022) A neuronal prospect theory model in the brain reward circuitry. Nat Commun 13: 5855. https://doi.org/10.1038/s41467-022-33579-0 doi: 10.1038/s41467-022-33579-0
|
| [20] |
Kahneman D, Tversky A (1979) Prospect Theory: An analysis of decision under risk. Econometrica 47: 263–291. https://doi.org/10.2307/1914185 doi: 10.2307/1914185
|
| [21] | Kahneman D, Tversky A, (Eds.). (2000) Choices, Values, and Frames. Cambridge University Press. https://doi.org/10.1017/CBO9780511803475 |
| [22] |
Kawai T, Yamada H, Sato N, et al. (2015) Roles of the lateral habenula and anterior cingulate cortex in negative outcome monitoring and behavioral adjustment in nonhuman primates. Neuron 88: 792–804. https://doi.org/10.1016/j.neuron.2015.09.030 doi: 10.1016/j.neuron.2015.09.030
|
| [23] | Larson F, List J, Metcalfe R (2016) Can myopic loss aversion explain the equity premium puzzle? evidence from a natural field experiment with professional traders. Nat Bureau Econ Res Available from: http://www.nber.org/papers/w22605. |
| [24] |
LeDoux JE (2000) Emotion circuits in the brain. Annu Rev Neurosci 23: 155–184. https://doi.org/10.1146/annurev.neuro.23.1.155 doi: 10.1146/annurev.neuro.23.1.155
|
| [25] |
Lejarraga T, Hertwig R (2017) How the threat of losses makes people explore more than the promise of gains. Psychon Bull & Rev 24: 708–720. https://doi.org/10.3758/s13423-016-1158-7 doi: 10.3758/s13423-016-1158-7
|
| [26] | Liao W, Jiang Y, Li D, et al. (2022) Cognition contra camouflage: How the brain mediates predator-driven crypsis evolution. Sci Adv 8. http://dx.doi.org/10.1126/sciadv.abq1878 |
| [27] |
Liberman N, Idson L, Higgins E (2005) Predicting the intensity of losses vs. non-gains and non-losses vs. gains in judging fairness and value: A test of the loss aversion explanation. J Exp Soc Psychol 41: 527–534. https://doi.org/10.1016/j.jesp.2004.06.007 doi: 10.1016/j.jesp.2004.06.007
|
| [28] |
Linzmajer M, Hubert M, Hubert M (2021) It's about the process, not the result: An fMRI approach to explore the encoding of explicit and implicit price information. J Econ Psychol 86: 102403. https://doi.org/10.1016/j.joep.2021.102403 doi: 10.1016/j.joep.2021.102403
|
| [29] |
Machina M (1982) "Expected Utility" analysis without the independence axiom. Econometrica 50: 277–323. https://doi.org/10.2307/1912631 doi: 10.2307/1912631
|
| [30] |
McGraw A, Larsen J, Kahneman D, et al. (2010) Comparing gains and losses. Psychol Sci 21: 1438–1445. https://doi.org/10.1177/0956797610381504 doi: 10.1177/0956797610381504
|
| [31] |
Mengov G, Georgiev N, Zinovieva I (2022) Virtual social networking increases the individual's economic predictability. J Behav Exp Econ 101: 101944. https://doi.org/10.1016/j.socec.2022.101944 doi: 10.1016/j.socec.2022.101944
|
| [32] |
Meyer S, Pagel M (2022) Fully Closed: Individual tesponses to realized gains and losses. J Financ 77: 1529–1585. https://doi.org/10.1111/jofi.13122 doi: 10.1111/jofi.13122
|
| [33] |
Mogiliansky LA, Zamir S, Zwirn H (2009) Type indeterminacy: A model of the KT (Kahneman–Tversky) –man. J Math Psychol 53: 349–361. https://doi.org/10.1016/j.jmp.2009.01.001 doi: 10.1016/j.jmp.2009.01.001
|
| [34] | Neumann J, Morgenstern O (1947) Theory of games and economic behavior, Princeton University Press, 1947. |
| [35] |
Nowaihi A, Dhami S (2006) A simple derivation of Prelec's probability weighting function. J Math Psychol 50: 521–524. https://doi.org/10.1016/j.jmp.2006.07.006 doi: 10.1016/j.jmp.2006.07.006
|
| [36] |
Padoa-Schioppa C, Assad JA (2006) Neurons in the orbitofrontal cortex encode economic value. Nature 441: 223–226. https://doi.org/10.1038/nature04676 doi: 10.1038/nature04676
|
| [37] | Pammi V, Miyapuram K (2012) Neuroeconomics of individual decision making at multiple levels: a review. In Expanding Horizons Of The Mind Science(s), 159–185. Nova Publications, New York. |
| [38] |
Paul E, Mendl M (2018) Animal emotion: Descriptive and prescriptive definitions and their implications for a comparative perspective. Appl Anim Behav Sci 205: 202–209. https://doi.org/10.1016/j.applanim.2018.01.008 doi: 10.1016/j.applanim.2018.01.008
|
| [39] |
Phelps EA, LeDoux JE (2005) Contributions of the amygdala to emotion processing: From animal models to human behavior. Neuron 48: 175–187. https://doi.org/10.1016/j.neuron.2005.09.025 doi: 10.1016/j.neuron.2005.09.025
|
| [40] |
Preston S, de Waal FBM (2002) Empathy: Its ultimate and proximate bases. Behav Brain Sci 25: 1–20. https://doi.org/10.1017/s0140525x02000018 doi: 10.1017/s0140525x02000018
|
| [41] |
Rosales-Ruiz J, Baer D (1997) Behavioral cusps: A developmental and pragmatic concept for behavior analysis. J Appl Behav Anal 30: 533–544. https://doi.org/10.1901/jaba.1997.30-533 doi: 10.1901/jaba.1997.30-533
|
| [42] |
Sano K (2022) A binary decision model and fat tails in financial market. Appl Sci 12: 7019. https://doi.org/10.1037/0022-3514.81.4.684 doi: 10.1037/0022-3514.81.4.684
|
| [43] |
Shefrin H, Statman M (1985) The disposition to sell winners too early and ride losers too long: Theory and evidence. J Financ 40(3): 777–790. https://doi.org/10.1111/j.1540-6261.1985.tb05002.x doi: 10.1111/j.1540-6261.1985.tb05002.x
|
| [44] | Smith A (1759) The Theory of Moral Sentiments, 1st ed. (printed for Andrew Millar, in the Strand). |
| [45] | Smith A (1776) The Wealth of Nations, 1st ed. (W. Strahan). |
| [46] |
Smith G, McDougall D, Edelen-Smith P (2006) Behavioral cusps: A person-centered concept for establishing pivotal individual, family, and community behaviors and repertoires. Focus Autism Dev Dis 21: 223–229. https://doi.org/10.1177/10883576060210040301 doi: 10.1177/10883576060210040301
|
| [47] | Stigler G, Becker G (1977) De gustibus non est disputandum. Ame Econ Rev 67: 76–90. https://www.jstor.org/stable/1807222 |
| [48] |
Strotz R (1955) Myopia and inconsistency in dynamic utility maximization. Rev Econ Stud 23: 165–180. https://doi.org/10.2307/2295722 doi: 10.2307/2295722
|
| [49] | Thaler R, Shefrin H (1981) An economic theory of self-control. J Polit Econ 89: 392–406. https://www.jstor.org/stable/1833317 |
| [50] |
Thaler R (1981) Some empirical evidence on dynamic inconsistency. Econ Lett 8: 201–207. https://doi.org/10.1016/0165-1765(81)90067-7 doi: 10.1016/0165-1765(81)90067-7
|
| [51] |
Thaler R (1989) Toward a positive theory of consumer choice. J Econ Behav & Organ 1: 39–60. https://doi.org/10.1016/0167-2681(80)90051-7 doi: 10.1016/0167-2681(80)90051-7
|
| [52] | Tversky A, Kahneman D (1974) Judgment under Uncertainty: Heuristics and Biases. Science 185: 1124–1131. https://www.jstor.org/stable/1738360 |
| [53] | Tversty A, Kahneman D (1992) Advances in prospect theory: Cumulative representation of uncertainty. J Risk Uncertain 5: 297–323. https://www.jstor.org/stable/41755005 |
| [54] |
Wallerius ML, Johnsson J, Cooke S, et al. (2020) Hook Avoidance Induced by Private and Social Learning in Common Carp. Transactions Am Fisheries Society 149: 498–511. https://doi.org/10.1002/tafs.10246 doi: 10.1002/tafs.10246
|
| [55] |
Walther M, Münster M (2021) Conditional risk premiums and the value function of prospect theory. J Behav Financ 22: 74–83. https://doi.org/10.1080/15427560.2020.1735390 doi: 10.1080/15427560.2020.1735390
|
| [56] |
Wei X, Zhang Y, Luo XR, et al. (2024) Qualitative Cusp Catastrophe Multi-Agent Simulation Model to Qualitative Cusp Catastrophe Multi-Agent Simulation Model to Explore Abrupt Changes in Online Impulsive Buying Behavior. J Association Inf Syst 25: 304–340. https://doi.org/10.17705/1jais.00832 doi: 10.17705/1jais.00832
|
| [57] |
Weitzman M (2001) Gamma discounting. Ame Econ Rev 91: 260–271. https://doi.org/10.1257/aer.91.1.260 doi: 10.1257/aer.91.1.260
|
| [58] |
Whitney H (1955) On singularities of mappings of euclidean spaces. I. Mappings of the plane into the plane. Ann Math 62: 374–410. https://doi.org/10.2307/1970070 doi: 10.2307/1970070
|
| [59] |
Yamada H, Imaizumi Y, Matsumoto M (2021) Neural population dynamics underlying expected value computation. J Neurosci 41: 1684–1698. https://doi.org/10.1523/JNEUROSCI.1987-20.2020 doi: 10.1523/JNEUROSCI.1987-20.2020
|
| [60] | Yamamoto S (2016) Primate empathy: three factors and their combinations for empathy‐related phenomena. WIREs Cognitive Sci 8. https://doi.org/10.1002/wcs.1431 |
| [61] | Yang Y, Li X, Stuphorn V (2022) Primate anterior insular cortex represents economic decision variables proposed by prospect theory. Nat Commun 13. https://doi.org/10.1038/s41467-022-28278-9 |
| [62] |
Zablocki-Thomas P, Rogers F, Bales K (2022) Neuroimaging of human and non-human animal emotion and affect in the context of social relationships. Front Behav Neurosci: 16. https://doi.org/10.3389/fnbeh.2022.994504 doi: 10.3389/fnbeh.2022.994504
|
| [63] |
Zeeman E (1976) Catastrophe Theory. Sci Am 234: 65–83. https://doi.org/10.1038/scientificamerican0476-65 doi: 10.1038/scientificamerican0476-65
|


Figures(9) / Tables(1)

Kazuo Sano. New concept for the value function of prospect theory[J]. Quantitative Finance and Economics, 2024, 8(4): 733-756. doi: 10.3934/QFE.2024028


 DownLoad: