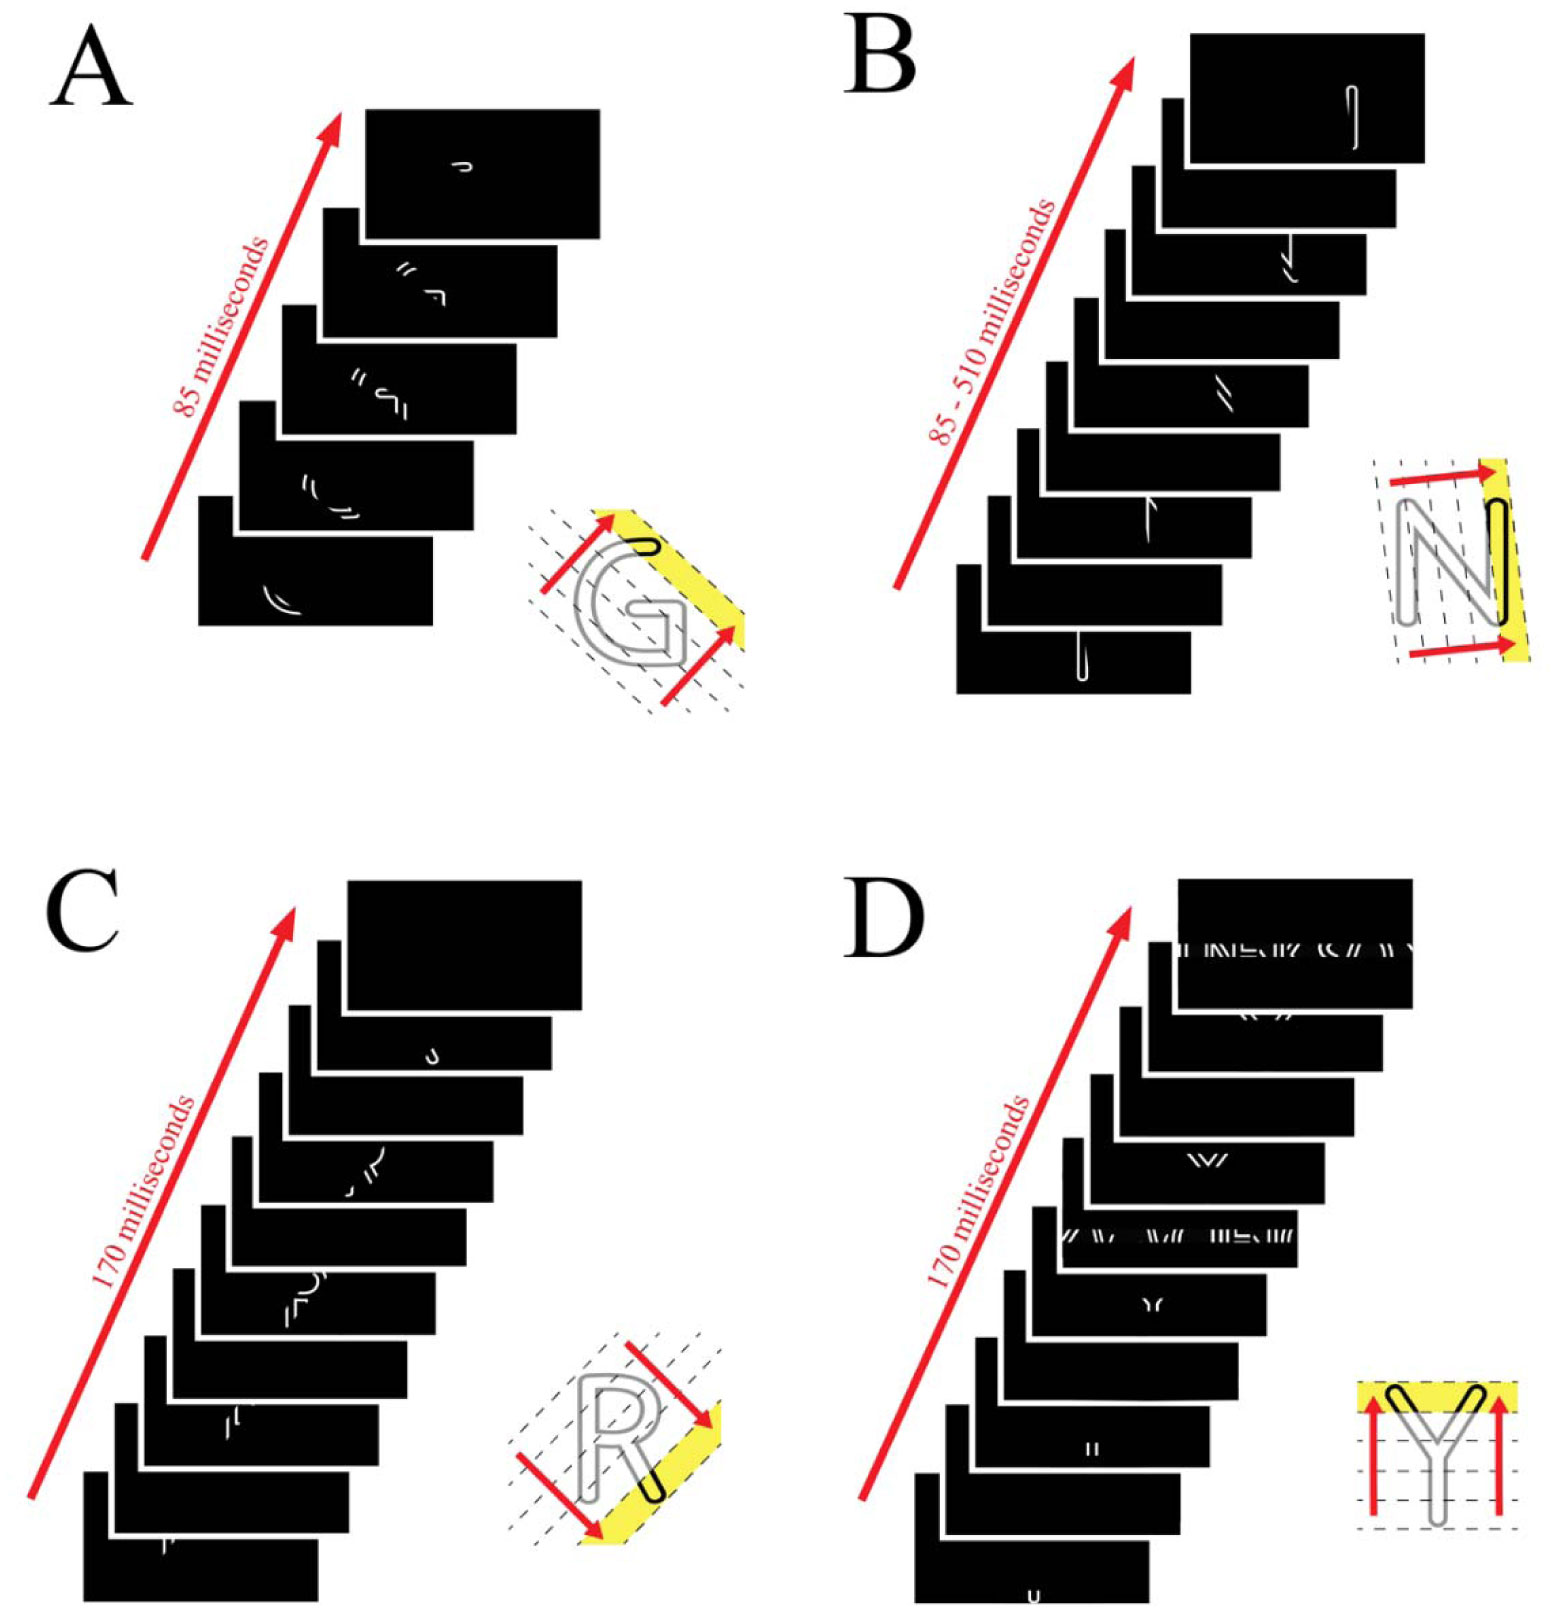
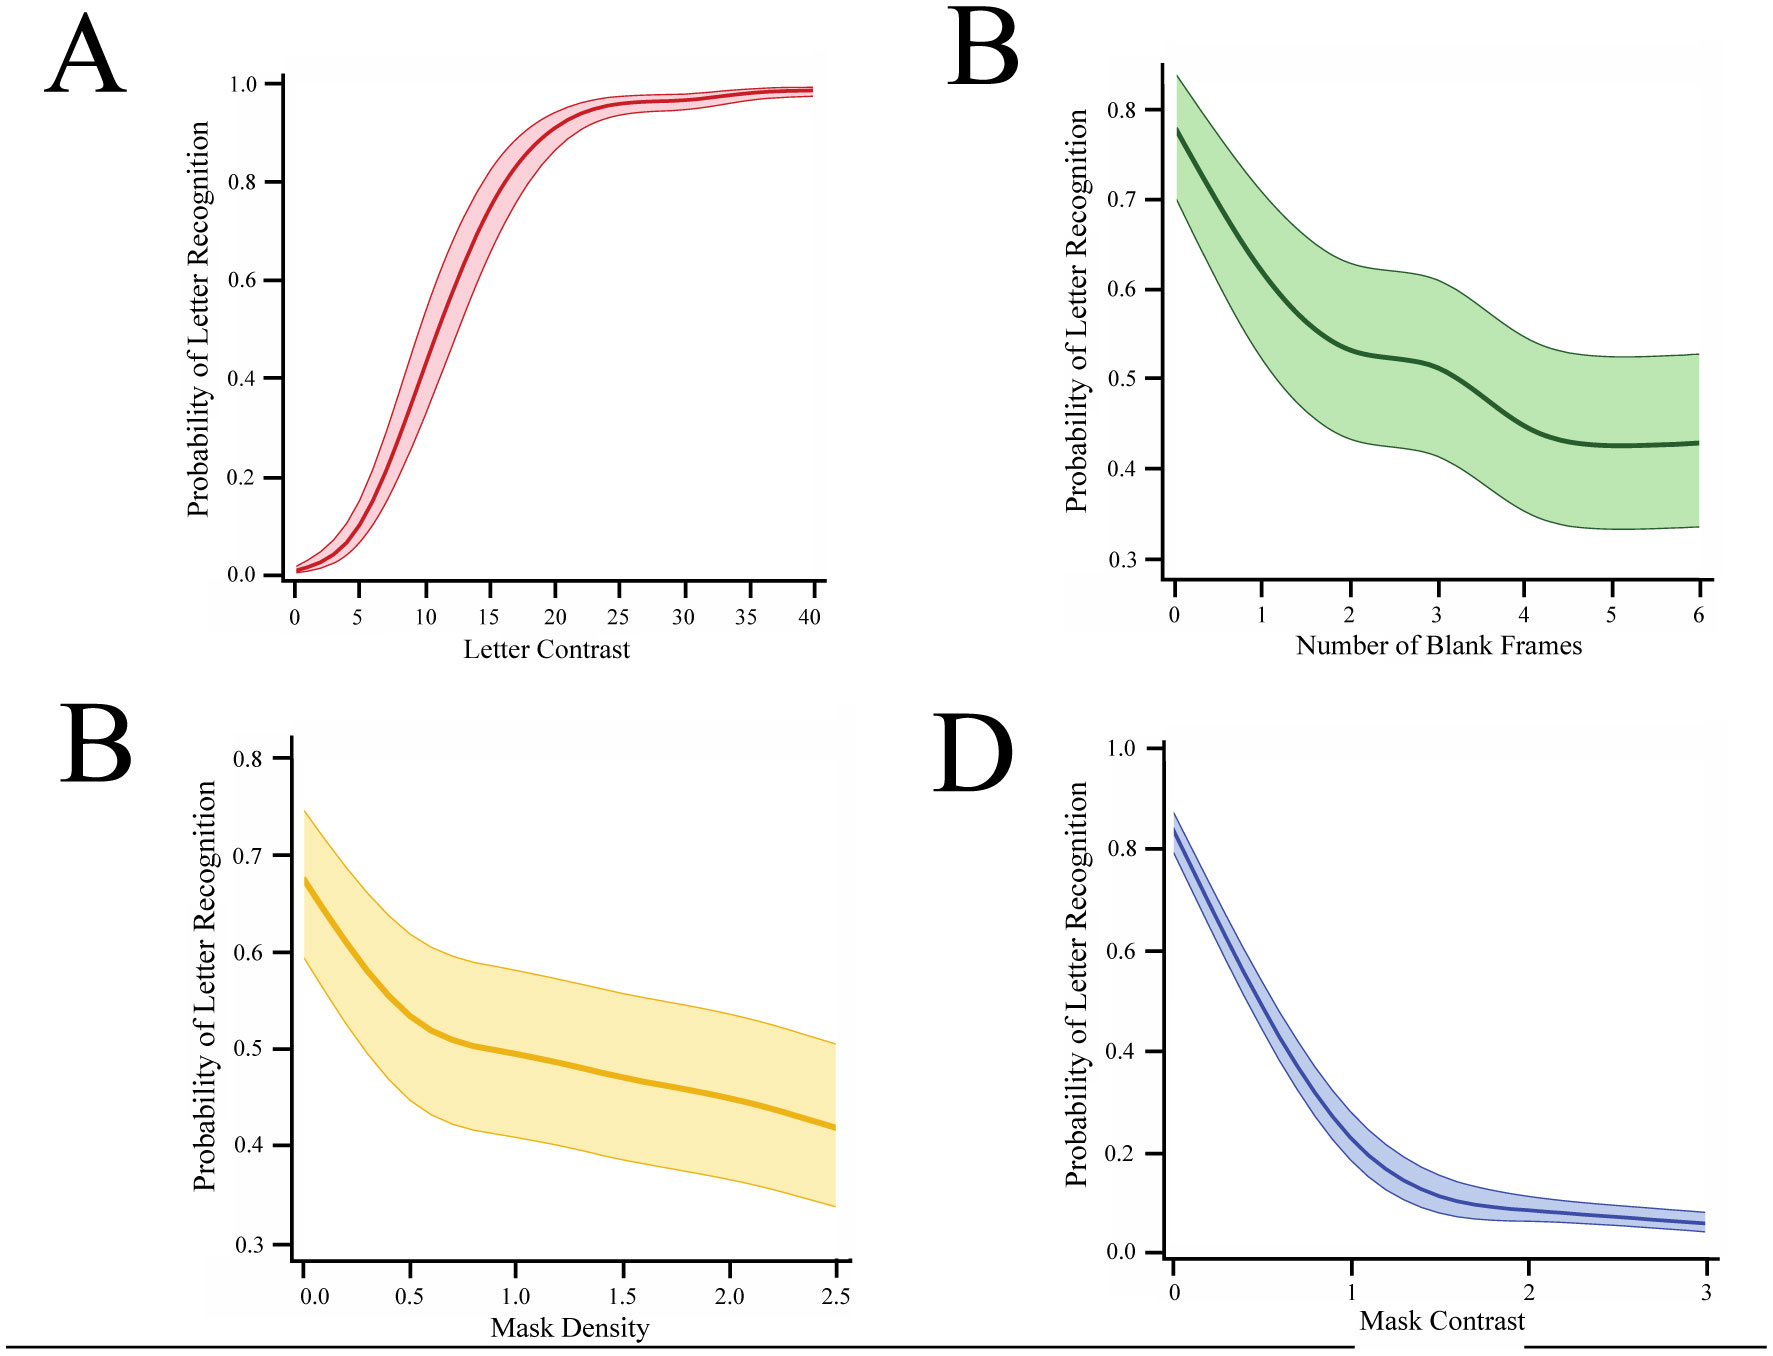
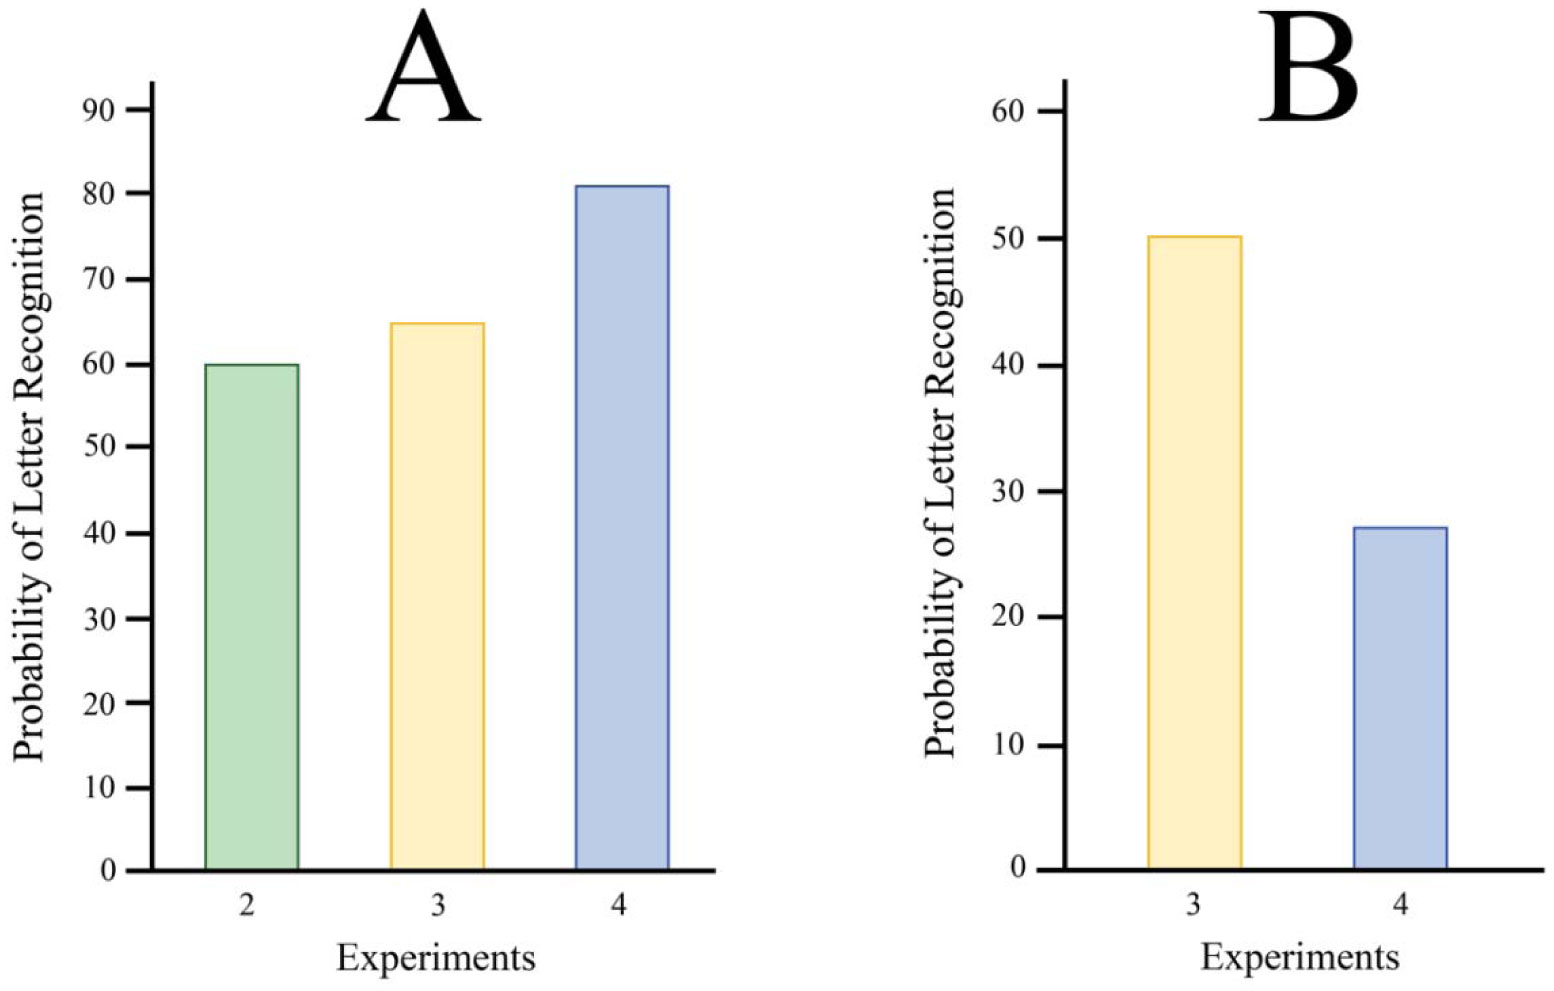
Shapes can be displayed as parts but perceived as a whole through feedforward and feedback mechanisms in the visual system, though the exact spatiotemporal relationships for this process are still unclear. Our experiments examined the integration of letter fragments that were displayed as a rapid sequence. We examined the effects of timing and masking on integration, hypothesizing that increasing the timing interval between frames would impair recognition by disrupting contour linkage. We further used different mask types, a full-field pattern mask and a smaller strip mask, to examine the effects of global vs local masking on integration. We found that varying mask types and contrast produced a greater decline in recognition than was found when persistence or mask density was manipulated. The study supports prior work on letter recognition and provides greater insight into the spatiotemporal factors that contribute to the identification of shapes.
Citation: Sherry Zhang, Jack Morrison, Wei Wang, Ernest Greene. Recognition of letters displayed as successive contour fragments[J]. AIMS Neuroscience, 2022, 9(4): 491-515. doi: 10.3934/Neuroscience.2022028
Shapes can be displayed as parts but perceived as a whole through feedforward and feedback mechanisms in the visual system, though the exact spatiotemporal relationships for this process are still unclear. Our experiments examined the integration of letter fragments that were displayed as a rapid sequence. We examined the effects of timing and masking on integration, hypothesizing that increasing the timing interval between frames would impair recognition by disrupting contour linkage. We further used different mask types, a full-field pattern mask and a smaller strip mask, to examine the effects of global vs local masking on integration. We found that varying mask types and contrast produced a greater decline in recognition than was found when persistence or mask density was manipulated. The study supports prior work on letter recognition and provides greater insight into the spatiotemporal factors that contribute to the identification of shapes.
area under the curve
electroencephalography
event related potential
functional magnetic resonance imaging
light emitting diode
receiver operating characteristic
primary visual cortex

| [1] |
Di Lollo V, Dixon P (1988) Two forms of persistence in visual information processing. J Exp Psychol Human 14: 671-681. https://doi.org/10.1037/0096-1523.14.4.671 
|
| [2] |
Di Lollo V, Bischof WF (1995) Inverse-intensity effect in duration of visible persistence. Psychol Bull 118: 223-237. https://doi.org/10.1037/0033-2909.118.2.223
|
| [3] |
Eriksen CW, Collins JF (1967) Some temporal characteristics of visual pattern perception. J Exp Psychol 74: 476-484. https://doi.org/10.1037/h0024765
|
| [4] |
Eriksen CW, Collins JF (1968) Sensory traces versus the psychological moment in the temporal organization of form. J Exp Psychol 77: 376-382. https://doi.org/10.1037/h0025931
|
| [5] |
Bethlehem DW (1968) An alternative method of testing differential recognition thresholds in a tachistoscope. Percep Motor Skill 26: 868-868. https://doi.org/10.2466/pms.1968.26.3.868
|
| [6] |
Cormier P, Tomlinson-Keasey C (1991) The development of hemispheric specialization of letter matching. Dev Neuropsychol 7: 161-176. https://doi.org/10.1080/87565649109540485
|
| [7] |
Greene E, Visani A (2015) Recognition of letters displayed as briefly flashed dot patterns. Atten Percept Psycho 77: 1955-1969. https://doi.org/10.3758/s13414-015-0913-6
|
| [8] |
Burchfield T, Greene E (2020) Evaluating spatiotemporal integration of shape cues. PLOS ONE 15: e0224530. https://doi.org/10.1371/journal.pone.0224530
|
| [9] |
Anstis SM, Atkinson J (1967) Distortions in Moving Figures Viewed through a Stationary Slit. Am J Psychol 80: 572-585. https://doi.org/10.2307/1421189
|
| [10] |
Rock I (1981) Anorthoscopic Perception. Sci Am 244: 145-153. https://doi.org/10.1038/scientificamerican0381-145
|
| [11] |
Orlov T, Zohary E (2018) Object Representations in Human Visual Cortex Formed Through Temporal Integration of Dynamic Partial Shape Views. J Neurosci 38: 659-678. https://doi.org/10.1523/JNEUROSCI.1318-17.2017
|
| [12] |
Baker DH (2013) What Is the Primary Cause of Individual Differences in Contrast Sensitivity?. PLOS ONE 8: e69536. https://doi.org/10.1371/journal.pone.0069536
|
| [13] |
Pelli DG, Bex P (2013) Measuring contrast sensitivity. Vision Res 90: 10-14. https://doi.org/10.1016/j.visres.2013.04.015
|
| [14] |
Sperling G (1960) The information available in brief conscious presentations. Psychol Monogr 74. https://doi.org/10.1037/h0093759
|
| [15] |
Anstis SM, Atkinson J (1967) Distortions in Moving Figures Viewed through a Stationary Slit. Am J Psychol 80: 572-585. https://doi.org/10.2307/1421189
|
| [16] |
Hubel DH, Wiesel TN (1959) Receptive fields of single neurones in the cat's striate cortex. J Physiol 148: 574-591. https://doi.org/10.1113/jphysiol.1959.sp006308
|
| [17] |
Hubel DH, Wiesel TN (1968) Receptive fields and functional architecture of monkey striate cortex. J Physiol 195: 215-243. https://doi.org/10.1113/jphysiol.1968.sp008455
|
| [18] |
Snodderly DM, Gur M (1995) Organization of striate cortex of alert, trained monkeys (Macaca fascicularis): ongoing activity, stimulus selectivity, and widths of receptive field activating regions. J Neurophysiol 74: 2100-2125. https://doi.org/10.1152/jn.1995.74.5.2100
|
| [19] |
Kara P, Reid RC (2003) Efficacy of Retinal Spikes in Driving Cortical Responses. J Neurosci 23: 8547-8557. https://doi.org/10.1523/JNEUROSCI.23-24-08547.2003
|
| [20] |
Fries P, Reynolds JH, Rorie AE, et al. (2001) Modulation of Oscillatory Neuronal Synchronization by Selective Visual Attention. Science 291: 1560-1563. https://doi.org/10.1126/science.1055465
|
| [21] |
Johnson JS, Olshausen BA (2003) Timecourse of neural signatures of object recognition. J Vision 3: 4. https://doi.org/10.1167/3.7.4
|
| [22] |
Sperling G (1963) A Model for Visual Memory Tasks. Hum Factors 5: 19-31. https://doi.org/10.1177/001872086300500103
|
| [23] |
Sperling G (1967) Successive approximations to a model for short term memory. Acta Psychol 27: 285-292. https://doi.org/10.1016/0001-6918(67)90070-4
|
| [24] |
Turvey MT (1973) On peripheral and central processes in vision: Inferences from an information-processing analysis of masking with patterned stimuli. Psychol Rev 80: 1-52. https://doi.org/10.1037/h0033872
|
| [25] |
Fahrenfort JJ, Scholte HS, Lamme VAF (2007) Masking Disrupts Reentrant Processing in Human Visual Cortex. J Cognitive Neurosci 19: 1488-1497. https://doi.org/10.1162/jocn.2007.19.9.1488
|
| [26] |
Koivisto M, Revonsuo A (2010) Event-related brain potential correlates of visual awareness. Neurosci Biobehav R 34: 922-934. https://doi.org/10.1016/j.neubiorev.2009.12.002
|
| [27] |
van Loon AM, Scholte HS, van Gaal S, et al. (2012) GABAA Agonist Reduces Visual Awareness: A Masking–EEG Experiment. J Cognitive Neurosci 24: 965-974. https://doi.org/10.1162/jocn_a_00197
|
| [28] | Breitmeyer BG, Hoar WS, Randall DJ, et al. (1984) Visual masking: An integrative approach. Clarendon Press. |
| [29] |
Enns JT, Di Lollo V (2000) What's new in visual masking?. Trends Cogn Sci 4: 345-352. https://doi.org/10.1016/S1364-6613(00)01520-5
|
| [30] |
Ogmen H, Breitmeyer BG, Melvin R (2003) The what and where in visual masking. Vision Res 43: 1337-1350. https://doi.org/10.1016/S0042-6989(03)00138-X
|
| [31] |
Pelli DG, Palomares M, Majaj NJ (2004) Crowding is unlike ordinary masking: Distinguishing feature integration from detection. J Vision 4: 12. https://doi.org/10.1167/4.12.12
|
| [32] |
Eisner DA (1972) Life-Span Age Differences in Visual Perception. Percept Mot Skills 34: 857-858. https://doi.org/10.2466/pms.1972.34.3.857
|
| [33] |
Faubert J (2002) Visual perception and aging. Can J Exp Psychol 56: 164-176. https://doi.org/10.1037/h0087394
|
| [34] |
Yamada Y (2015) Gender and age differences in visual perception of pattern randomness. Sci Postprint 1: e00041. https://doi.org/10.14340/spp.2015.01A0002
|
| [35] |
Kimchi R, Amishav R, Sulitzeanu-Kenan A (2009) Gender differences in global–local perception? Evidence from orientation and shape judgments. Acta Psychol 130: 64-71. https://doi.org/10.1016/j.actpsy.2008.10.002
|
| [36] |
Lee J, Kim S-H, Jeong SY, et al. (2015) A Stereoscopic 3-D Broadcasting System Using Fixed and Mobile Hybrid Delivery and the Quality Assessment of the Mixed Resolution Stereoscopic Video. IEEE T Broadcast 61: 222-237. https://doi.org/10.1109/TBC.2015.2419193
|
| [37] |
Li L, Chen C, Hu X, et al. (2021) Visual perception of computer-generated stereoscopic pictures: Toward the impact of image resolution. Signal Process Image 96: 116301. https://doi.org/10.1016/j.image.2021.116301
|
| [38] |
Eriksen CW, Lappin JS (1964) Luminance summation-contrast reduction as a basis for certain forward and backward masking effects. Psychon Sci 1: 313-314. https://doi.org/10.3758/BF03342929
|
| [39] |
Thompson JH (1966) What happens to the stimulus in backward masking?. J Exp Psychol 71: 580-586. https://doi.org/10.1037/h0022957
|
| [40] |
Long GM, Rourke DA (1989) Training Effects on the Resolution of Moving Targets—Dynamic Visual Acuity. Hum Factors 31: 443-451. https://doi.org/10.1177/001872088903100407
|
| [41] |
Sceniak MP, Hawken MJ, Shapley R (2001) Visual Spatial Characterization of Macaque V1 Neurons. J Neurophysiol 85: 1873-1887. https://doi.org/10.1152/jn.2001.85.5.1873
|
| [42] |
Milner PM (1974) A model for visual shape recognition. Psychol Rev 81: 521-535. https://doi.org/10.1037/h0037149
|
| [43] |
Singer W (1993) Synchronization of cortical activity and its putative role in information processing and learning. Annu Rev Physiol 55: 349-374. https://doi.org/10.1146/annurev.ph.55.030193.002025
|
| [44] |
Singer W, Gray CM (1995) Visual Feature Integration and the Temporal Correlation Hypothesis. Annu Rev Neurosci 18: 555-586. https://doi.org/10.1146/annurev.ne.18.030195.003011
|
| [45] |
Engel AK, König P, Kreiter AK, et al. (1992) Temporal coding in the visual cortex: new vistas on integration in the nervous system. Trends Neurosci 15: 218-226. https://doi.org/10.1016/0166-2236(92)90039-B
|
| [46] |
Maldonado P, Babul C, Singer W, et al. (2008) Synchronization of Neuronal Responses in Primary Visual Cortex of Monkeys Viewing Natural Images. J Neurophysiol 100: 1523-1532. https://doi.org/10.1152/jn.00076.2008
|
| [47] |
Ts'o DY, Gilbert CD (1988) The organization of chromatic and spatial interactions in the primate striate cortex. J Neurosci 8: 1712-1727. https://doi.org/10.1523/JNEUROSCI.08-05-01712.1988
|
| [48] |
Kreiter AK, Singer W (1992) Oscillatory Neuronal Responses in the Visual Cortex of the Awake Macaque Monkey. Eur J Neurosci 4: 369-375. https://doi.org/10.1111/j.1460-9568.1992.tb00884.x
|
| [49] |
König P, Engel AK, Singer W (1995) Relation between oscillatory activity and long-range synchronization in cat visual cortex. P Natl Acad Sci 92: 290-294. https://doi.org/10.1073/pnas.92.1.290
|
| [50] |
Friedman-Hill S, Maldonado PE, Gray CM (2000) Dynamics of striate cortical activity in the alert macaque: I. Incidence and stimulus-dependence of gamma-band neuronal oscillations. Cereb Cortex 10: 1105-1116. https://doi.org/10.1093/cercor/10.11.1105
|
| [51] |
Coltheart M (1980) Iconic memory and visible persistence. Percept Psycho 27: 183-228. https://doi.org/10.3758/BF03204258
|
| [52] |
Kinnucan MT, Friden TP (1981) Visual form integration and discontinuity detection. J Exp Psychol Human 7: 948-953. https://doi.org/10.1037/0096-1523.7.5.948
|
| [53] |
Greene E (2016) Information persistence evaluated with low-density dot patterns. Acta Psychol 170: 215-225. https://doi.org/10.1016/j.actpsy.2016.08.005
|
| [54] |
Phillips WA (1974) On the distinction between sensory storage and short-term visual memory. Percept Psycho 16: 283-290. https://doi.org/10.3758/BF03203943
|
| [55] |
Baddeley A (1992) Working Memory. Science 255: 556-559. https://doi.org/10.1126/science.1736359
|
| [56] |
Bair W, Cavanaugh JR, Smith MA, et al. (2002) The Timing of Response Onset and Offset in Macaque Visual Neurons. J Neurosci 22: 3189-3205. https://doi.org/10.1523/JNEUROSCI.22-08-03189.2002
|
| [57] |
Celebrini S, Thorpe S, Trotter Y, et al. (1993) Dynamics of orientation coding in area V1 of the awake primate. Visual Neurosci 10: 811-825. https://doi.org/10.1017/S0952523800006052
|
| [58] |
Kirchner H, Barbeau EJ, Thorpe SJ, et al. (2009) Ultra-Rapid Sensory Responses in the Human Frontal Eye Field Region. J Neurosci 29: 7599-7606. https://doi.org/10.1523/JNEUROSCI.1233-09.2009
|
| [59] |
Vogels R (1999) Categorization of complex visual images by rhesus monkeys. Part 2: single-cell study. Eur J Neurosci 11: 1239-1255. https://doi.org/10.1046/j.1460-9568.1999.00531.x
|
| [60] |
Nobre AC, Allison T, McCarthy G (1994) Word recognition in the human inferior temporal lobe. Nature 372: 260-263. https://doi.org/10.1038/372260a0
|
| [61] |
Wurtz RH (1969) Visual receptive fields of striate cortex neurons in awake monkeys. Journal of Neurophysiol 32: 727-742. https://doi.org/10.1152/jn.1969.32.5.727
|
| [62] |
Xing D, Yeh C-I, Burns S, et al. (2012) Laminar analysis of visually evoked activity in the primary visual cortex. P Natl Acad Sci 109: 13871-13876. https://doi.org/10.1073/pnas.1201478109
|
| [63] |
Chelazzi L, Duncan J, Miller EK, et al. (1998) Responses of Neurons in Inferior Temporal Cortex During Memory-Guided Visual Search. J Neurophysiol 80: 2918-2940. https://doi.org/10.1152/jn.1998.80.6.2918
|
| [64] |
Albrecht DG, Geisler WS, Frazor RA, et al. (2002) Visual Cortex Neurons of Monkeys and Cats: Temporal Dynamics of the Contrast Response Function. J Neurophysiol 88: 888-913. https://doi.org/10.1152/jn.2002.88.2.888
|
| [65] |
Carey MR, Myoga MH, McDaniels KR, et al. (2011) Presynaptic CB1 Receptors Regulate Synaptic Plasticity at Cerebellar Parallel Fiber Synapses. J Neurophysiol 105: 958-963. https://doi.org/10.1152/jn.00980.2010
|
| [66] |
Sakurai A, Katz PS (2009) State-, Timing-, and Pattern-Dependent Neuromodulation of Synaptic Strength by a Serotonergic Interneuron. J Neurosci 29: 268-279. https://doi.org/10.1523/JNEUROSCI.4456-08.2009
|
| [67] |
Nikolić D, Häusler S, Singer W, et al. (2009) Distributed Fading Memory for Stimulus Properties in the Primary Visual Cortex. PLOS Biology 7: e1000260. https://doi.org/10.1371/journal.pbio.1000260
|
| [68] |
Castelo-Branco M, Neuenschwander S, Singer W (1998) Synchronization of Visual Responses between the Cortex, Lateral Geniculate Nucleus, and Retina in the Anesthetized Cat. J Neurosci 18: 6395-6410. https://doi.org/10.1523/JNEUROSCI.18-16-06395.1998
|
| [69] |
Fuster JM, Jervey JP (1981) Inferotemporal Neurons Distinguish and Retain Behaviorally Relevant Features of Visual Stimuli. Science 212: 952-955. https://doi.org/10.1126/science.7233192
|
| [70] |
Rolls ET, Tovee M (1994) Processing speed in the cerebral cortex and the neurophysiology of visual masking. P Roy Soc B-Biol Sci 257: 9-15. https://doi.org/10.1098/rspb.1994.0087
|
| [71] |
Miyashita Y, Chang HS (1988) Neuronal correlate of pictorial short-term memory in the primate temporal cortexYasushi Miyashita. Nature 331: 68-70. https://doi.org/10.1038/331068a0
|
| [72] |
Keysers C, Xiao D-K, Földiák P, et al. (2005) Out of sight but not out of mind: the neurophysiology of iconic memory in the superior temporal sulcus. Cogn Neuropsychol 22: 316-332. https://doi.org/10.1080/02643290442000103
|
| [73] |
Ling S, Lee ACH, Armstrong BC, et al. (2019) How are visual words represented? Insights from EEG-based visual word decoding, feature derivation and image reconstruction. Hum Brain Mapp 40: 5056-5068. https://doi.org/10.1002/hbm.24757
|
| [74] | Kolers PA (1968) Some psychological aspects of pattern recognition. Recognizing Patterns : 4-61. |
| [75] |
Scheerer E (1973) Integration, interruption and processing rate in visual backward masking. Psychol Forsch 36: 71-93. https://doi.org/10.1007/BF00424655
|
| [76] |
Webster RJ, Hassall C, Herdman CM, et al. (2013) Disruptive camouflage impairs object recognition. Biol Lett 9: 20130501. https://doi.org/10.1098/rsbl.2013.0501
|
| [77] |
Lamme VAF, Zipser K, Spekreijse H (2002) Masking Interrupts Figure-Ground Signals in V1. J Cogn Neurosci 14: 1044-1053. https://doi.org/10.1162/089892902320474490
|
| [78] |
Wilenius-Emet M, Revonsuo A, Ojanen V (2004) An electrophysiological correlate of human visual awareness. Neurosci Lett 354: 38-41. https://doi.org/10.1016/j.neulet.2003.09.060
|
| [79] |
Cul AD, Baillet S, Dehaene S (2007) Brain Dynamics Underlying the Nonlinear Threshold for Access to Consciousness. PLOS Biol 5: e260. https://doi.org/10.1371/journal.pbio.0050260
|
| [80] |
Dien J, Brian ES, Molfese DL, et al. (2013) Combined ERP/fMRI evidence for early word recognition effects in the posterior inferior temporal gyrus. Cortex 49: 2307-2321. https://doi.org/10.1016/j.cortex.2013.03.008
|
| [81] |
Dehaene S, Jobert A, Naccache L, et al. (2004) Letter Binding and Invariant Recognition of Masked Words: Behavioral and Neuroimaging Evidence. Psychol Sci 15: 307-313. https://doi.org/10.1111/j.0956-7976.2004.00674.x
|
| [82] |
Vinckier F, Dehaene S, Jobert A, et al. (2007) Hierarchical coding of letter strings in the ventral stream: dissecting the inner organization of the visual word-form system. Neuron 55: 143-156. https://doi.org/10.1016/j.neuron.2007.05.031
|
| [83] |
Kolers PA, Rosner BS (1960) On Visual Masking (Metacontrast): Dichoptic Observation. Am J Psychol 73: 2-21. https://doi.org/10.2307/1419113
|
| [84] |
Michaels CF, Turvey MT (1979) Central sources of visual masking: Indexing structures supporting seeing at a single, brief glance. Psychol Res 41: 1-61. https://doi.org/10.1007/BF00309423
|
| [85] |
Sligte IG, Scholte HS, Lamme VAF (2008) Are There Multiple Visual Short-Term Memory Stores?. PLOS ONE 3: e1699. https://doi.org/10.1371/journal.pone.0001699
|
| [86] | Meneghetti N, Cerri C, Tantillo E, et al. (2020) Thalamic inputs determine functionally distinct gamma bands in mouse primary visual cortex. bioRxiv . https://doi.org/10.1101/2020.07.09.194811 |
| [87] |
Saleem AB, Lien AD, Krumin M, et al. (2017) Subcortical Source and Modulation of the Narrowband Gamma Oscillation in Mouse Visual Cortex. Neuron 93: 315-322. https://doi.org/10.1016/j.neuron.2016.12.028
|
| [88] |
Henrie JA, Shapley R (2005) LFP power spectra in V1 cortex: the graded effect of stimulus contrast. J Neurophysiol 94: 479-490. https://doi.org/10.1152/jn.00919.2004
|
| [89] |
Kinsey K, Anderson SJ, Hadjipapas A, et al. (2011) The role of oscillatory brain activity in object processing and figure–ground segmentation in human vision. Int J Psychophysiol 79: 392-400. https://doi.org/10.1016/j.ijpsycho.2010.12.007
|
| [90] |
Muller L, Chavane F, Reynolds J, et al. (2018) Cortical travelling waves: mechanisms and computational principles. Nat Rev Neurosci 19: 255-268. https://doi.org/10.1038/nrn.2018.20
|
Figures(3) / Tables(1)

Sherry Zhang, Jack Morrison, Wei Wang, Ernest Greene. Recognition of letters displayed as successive contour fragments[J]. AIMS Neuroscience, 2022, 9(4): 491-515. doi: 10.3934/Neuroscience.2022028


 DownLoad: