Photolysis is currently being discussed and investigated as additional stage or at least part of an extended treatment for sustainable water purification in waste water treatment plants. This study describes the photoinduced degradation of four macrolide antibiotics using UVC/VUV-irradiation. Special attention was paid to the determination of ecotoxicity of the formed photoinduced degradation products. To this purpose, MIC values were determined and QSAR analysis was performed. Photo-induced degradation rates of the drug substances ranged from 0.39 min–1 to 2.47 min–1, with azithromycin showing the slowest degradation, followed by erythromycin and spiramycin. The degradation of tylosin proceeded the fastest. QSAR analysis indicated that most of the identified photoproducts were less eco-toxic than the original drugs. The corresponding MIC analysis demonstrated that the four macrolides were ineffective against the gram-negative Pseudomonas fluorescens but effective against the gram-positive Bacillus subtilis. The MIC determination of irradiated tylosin solutions showed exemplarily that prolongation of the irradiation times led to increasing MIC values of the solution, reduced efficacy and hence potentially less eco-toxicity of the irradiated solution and the degradates therein.
Citation: Melanie Voigt, Indra Bartels, Anna Nickisch-Hartfiel, Martin Jaeger. Elimination of macrolides in water bodies using photochemical oxidation[J]. AIMS Environmental Science, 2018, 5(5): 372-388. doi: 10.3934/environsci.2018.5.372
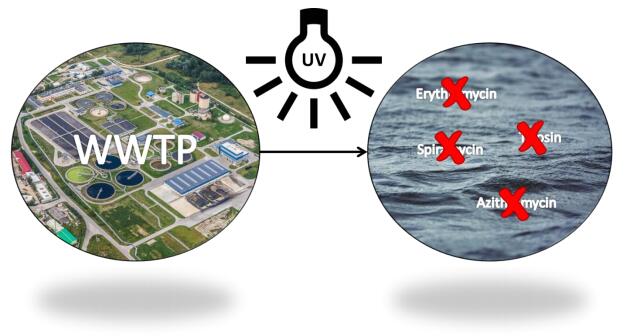
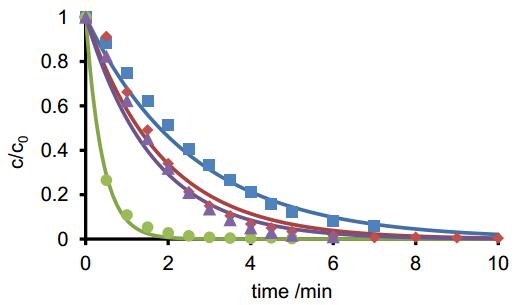
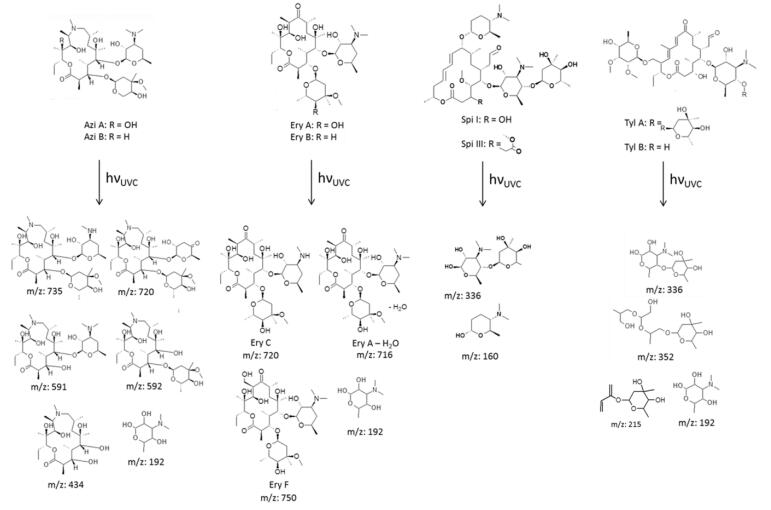
Photolysis is currently being discussed and investigated as additional stage or at least part of an extended treatment for sustainable water purification in waste water treatment plants. This study describes the photoinduced degradation of four macrolide antibiotics using UVC/VUV-irradiation. Special attention was paid to the determination of ecotoxicity of the formed photoinduced degradation products. To this purpose, MIC values were determined and QSAR analysis was performed. Photo-induced degradation rates of the drug substances ranged from 0.39 min–1 to 2.47 min–1, with azithromycin showing the slowest degradation, followed by erythromycin and spiramycin. The degradation of tylosin proceeded the fastest. QSAR analysis indicated that most of the identified photoproducts were less eco-toxic than the original drugs. The corresponding MIC analysis demonstrated that the four macrolides were ineffective against the gram-negative Pseudomonas fluorescens but effective against the gram-positive Bacillus subtilis. The MIC determination of irradiated tylosin solutions showed exemplarily that prolongation of the irradiation times led to increasing MIC values of the solution, reduced efficacy and hence potentially less eco-toxicity of the irradiated solution and the degradates therein.

| [1] |
Yang Y, Toor GS, Wilson PC, et al. (2017) Micropollutants in groundwater from septic systems : Transformations, transport mechanisms, and human health risk assessment. Water Res 123: 258–267. doi: 10.1016/j.watres.2017.06.054

|
| [2] |
Cartagena P, El Kaddouri M, Cases V, et al. (2013) Reduction of emerging micropollutants, organic matter, nutrients and salinity from real wastewater by combined MBR-NF/RO treatment. Sep Purif Technol 110: 132–143. doi: 10.1016/j.seppur.2013.03.024
|
| [3] |
Lee Y, Gerrity D, Lee M, et al. (2013) Prediction of micropollutant elimination during ozonation of municipal wastewater effluents: Use of kinetic and water specific information. Environ Sci Technol 47: 5872–5881. doi: 10.1021/es400781r
|
| [4] |
Kümmerer K (2009) Antibiotics in the aquatic environment-a review-part I. Chemosphere 75: 417–434. doi: 10.1016/j.chemosphere.2008.11.086
|
| [5] | Parsons S, Advanced Oxidation Processes for Water and Wastewater Treatment. IWA Publishing, 2004. |
| [6] | Oppenländer T, Photochemical Purification of Water and Air: Advanced Oxidation Processes (AOPs): Principles, Reaction Mechanisms, Reactor Concepts (Chemistry). WILEY-VCH Verlag, 2003. |
| [7] |
Pourakbar M, Moussavi G, Shekoohiyan S (2016) Homogenous VUV advanced oxidation process for enhanced degradation and mineralization of antibiotics in contaminated water. Ecotoxicol Environ Saf 125: 72–77. doi: 10.1016/j.ecoenv.2015.11.040
|
| [8] |
Sun L, Bolton JR (1996) Determination of the Quantum Yield for the Photochemical Generation of Hydroxyl Radicals in TiO 2 Suspensions. J Phys Chem 100: 4127–4134. doi: 10.1021/jp9505800
|
| [9] |
Voigt M, Jaeger M (2017) On the photodegradation of azithromycin, erythromycin and tylosin and their transformation products–A kinetic study. Sustain Chem Pharm 5: 131–140. doi: 10.1016/j.scp.2016.12.001
|
| [10] | Fick J, Andersson PL, Johansson M, et al. (2004) Selection of Antibiotics : A Chemometric Approach. 4th Int Conf Pharm Endocr Disrupting Chem Water, 143–150. |
| [11] |
Wold SSM, Eriksson L, Sjöström M, et al. (2001) PLS-regression: A basic tool of chemometrics. Chemom Intell Lab Syst 58: 109–130. doi: 10.1016/S0169-7439(01)00155-1
|
| [12] |
Kruhlak NL, Contrera JF, Benz RD, et al. (2007) Progress in QSAR toxicity screening of pharmaceutical impurities and other FDA regulated products. Adv Drug Deliv Rev 59: 43–55. doi: 10.1016/j.addr.2006.10.008
|
| [13] | Vracko M, Mathematical (Structural) Descriptors in QSAR: Applications in Drug Design and Environmental Toxicology. Advances in Mathematical Chemistry and Applications: Revised Edition 1, 2016. |
| [14] |
Zhu H, Shen Z, Tang Q, et al. (2014) Degradation mechanism study of organic pollutants in ozonation process by QSAR analysis. Chem Eng J 255: 431–436. doi: 10.1016/j.cej.2014.05.073
|
| [15] | Christian T, Schneider RJ, Färber HA, et al. (2003) Determination of Antibiotic Residues in Manure, Soil, and Surface Waters. Acta Hydrochim hydrobiol 31: 36–44. |
| [16] |
López-Serna R, Petrović M, Barceló D (2011) Development of a fast instrumental method for the analysis of pharmaceuticals in environmental and wastewaters based on ultra high performance liquid chromatography (UHPLC)-tandem mass spectrometry (MS/MS). Chemosphere 85: 1390–1399. doi: 10.1016/j.chemosphere.2011.07.071
|
| [17] |
Biel-Maeso M, Baena-Nogueras RM, Corada-Fernández C, et al. (2018) Occurrence, distribution and environmental risk of pharmaceutically active compounds (PhACs) in coastal and ocean waters from the Gulf of Cadiz (SW Spain). Sci Total Environ 612: 649–659. doi: 10.1016/j.scitotenv.2017.08.279
|
| [18] |
Lesser LE, Mora A, Moreau C, et al. (2018) Survey of 218 organic contaminants in groundwater derived from the world's largest untreated wastewater irrigation system: Mezquital Valley, Mexico. Chemosphere 198: 510–521. doi: 10.1016/j.chemosphere.2018.01.154
|
| [19] | Azanu D, Styrishave B, Darko G, et al. (2018) Occurrence and risk assessment of antibiotics in water and lettuce in Ghana. Sci Total Environ 622–623: 293–305. |
| [20] |
Ding H, Wu Y, Zhang W, et al. (2017) Occurrence, distribution, and risk assessment of antibiotics in the surface water of Poyang Lake, the largest freshwater lake in China. Chemosphere 184: 137–147. doi: 10.1016/j.chemosphere.2017.05.148
|
| [21] |
Liu J, Dan X, Lu G, et al. (2018) Investigation of pharmaceutically active compounds in an urban receiving water: Occurrence, fate and environmental risk assessment. Ecotoxicol Environ Saf 154: 214–220. doi: 10.1016/j.ecoenv.2018.02.052
|
| [22] |
Pereira AMPT, Silva LJG, Laranjeiro CSM, et al. (2017) Human pharmaceuticals in Portuguese rivers: The impact of water scarcity in the environmental risk. Sci Total Environ 609: 1182–1191. doi: 10.1016/j.scitotenv.2017.07.200
|
| [23] |
Du J, Zhao H, Liu S, et al. (2017) Antibiotics in the coastal water of the South Yellow Sea in China: Occurrence, distribution and ecological risks. Sci Total Environ 595: 521–527. doi: 10.1016/j.scitotenv.2017.03.281
|
| [24] | Boy-Roura M, Mas-Pla J, Petrovic M, et al. (2018) Towards the understanding of antibiotic occurrence and transport in groundwater: Findings from the Baix Fluvià alluvial aquifer (NE Catalonia, Spain). Sci Total Environ 612: 1387–1406. |
| [25] |
Watkinson J, Murby EJ, Costanzo SD (2007) Removal of antibiotics in conventional and advanced wastewater treatment: implications for environmental discharge and wastewater recycling. Water Res 41: 4164–4176. doi: 10.1016/j.watres.2007.04.005
|
| [26] |
Karthikeyan KG, Meyer MT (2006) Occurrence of antibiotics in wastewater treatment facilities in Wisconsin, USA. Sci. Total Environ 361: 196–207. doi: 10.1016/j.scitotenv.2005.06.030
|
| [27] | Prieto-Rodriguez L, Miralles-Cuevas S, Oller I, et al. (2012)Treatment of emerging contaminants in wastewater treatment plants (WWTP) effluents by solar photocatalysis using low TiO2 concentrations. J Hazard Mater 211–212: 131–137. |
| [28] |
Kafaei R, Papari F, Seyedabadi M, et al. (2018) Occurrence, distribution, and potential sources of antibiotics pollution in the water-sediment of the northern coastline of the Persian Gulf, Iran. Sci Total Environ 627: 703–712. doi: 10.1016/j.scitotenv.2018.01.305
|
| [29] |
Balakrishna K, Rath A, Praveenkumarreddy Y, et al. (2017) A review of the occurrence of pharmaceuticals and personal care products in Indian water bodies. Ecotoxicol Environ Saf 137: 113–120. doi: 10.1016/j.ecoenv.2016.11.014
|
| [30] |
Ben W, Zhu B, Yuan X, et al. (2018) Occurrence, removal and risk of organic micropollutants in wastewater treatment plants across China: Comparison of wastewater treatment processes. Water Res 130: 38–46. doi: 10.1016/j.watres.2017.11.057
|
| [31] | Al Hayawi AY, Ali HA, Abd Al-Qadir RS, et al. (2016) Effect of Ultraviolet Radiation to Antibiotics Resistance of Pseudomonas spp. Isolated from Wastewater in Tikrit City, Iraq. Al-Kufa Univ J Biol 8: 249–259. |
| [32] | Kuhn H (2004) Braslavsky, S. E. & Schmidt, R. Chemical Actinometry. IUPAC Tech Rep, 1–47. |
| [33] | Hatchard CG, Parker C (1956) A New Sensitive Chemical Actinometer. II. Potassium Ferrioxalate as a Standard Chemical Actinometer. Proc R Soc A Math Phys Eng Sci 235: 518–536. |
| [34] | Mauser H, Formale Kinetik. Experimentelle Methoden der Physik und der Chemie (Formal Kinetics. Experimental Methods of Physics and Chemistry). Düsseld. Bertelsmann-Universitätsverlag (1974). |
| [35] | Connors KA, Chemical Kinetics The Study of Reaction Rates in Solution. (VCH Verlagsgesellschaft, 1990). |
| [36] |
Voigt M, Savelsberg C, Jaeger M (2017) Photodegradation of the antibiotic spiramycin studied by high-performance liquid quadrupole time-of-flight mass spectrometry. Toxicol Environ Chem 99: 624–640. doi: 10.1080/02772248.2017.1280039
|
| [37] |
Voigt M, Bartels I, Nickisch-Hartfiel A, et al. (2017) Photoinduced degradation of sulfonamides, kinetic, and structural characterization of transformation products and assessment of environmental toxicity. Toxicol Environ Chem 99: 1304–1327. doi: 10.1080/02772248.2017.1373777
|
| [38] | EUCAST, E. C. O. A. S. T. ISO 20776-1:2007. (2007). |
| [39] | Wiegand I, Hilpert K, Hancock REW (2008) Agar and broth dilution methods to determine the minimal inhibitory concentration (MIC) of antimicrobial substances. Nat Protoc 3, 163–175. |
| [40] | Martin T, Harten P, Venkatapathy R, et al., T.E.S.T (Toxicity Estimation Software Tool). (2016). |
| [41] |
Sacher F, Thomas F (2001) Pharmaceuticals in groundwaters Analytical methods and results of a monitoring program in Baden-Württemberg, Germany. J Chromatogr 938: 199–210. doi: 10.1016/S0021-9673(01)01266-3
|
| [42] |
Kasprzyk-Hordern B, Dinsdale RM, Guwy AJ (2007) Multi-residue method for the determination of basic/neutral pharmaceuticals and illicit drugs in surface water by solid-phase extraction and ultra performance liquid chromatography-positive electrospray ionisation tandem mass spectrometry. J Chromatogr A 1161: 132–145. doi: 10.1016/j.chroma.2007.05.074
|
| [43] |
Zuckerman JM (2004) Macrolides and ketolides: azithromycin, clarithromycin, telithromycin. Infect Dis Clin North Am 18: 621–649. doi: 10.1016/j.idc.2004.04.010
|
| [44] |
Hassanzadeh A, Helliwell M, Barber J (2006) Determination of the stereochemistry of anhydroerythromycin A, the principal degradation product of the antibiotic erythromycin A. Org Biomol Chem 4: 1014–1019. doi: 10.1039/b518182h
|
| [45] |
Hassanzadeh A, Barber J, Morris G, et al. (2007) Mechanism for the degradation of erythromycin A and erythromycin A 2′-ethyl succinate in acidic aqueous solution. J Phys Chem A 111: 10098–10104. doi: 10.1021/jp073030y
|
| [46] |
Atkins PJ, Herbert TO, Jones NB (1986) Kinetic studies on the decomposition of erythromycin A in aqueous acidic and neutral buffers. Int J Pharm 30: 199–207. doi: 10.1016/0378-5173(86)90079-7
|
| [47] |
Chen BM, Liang YZ, Chen X, et al. (2006) Quantitative determination of azithromycin in human plasma by liquid chromatography-mass spectrometry and its application in a bioequivalence study. J Pharm Biomed Anal 42: 480–487. doi: 10.1016/j.jpba.2006.05.011
|
| [48] | Fiese EF, Steffen SH (1990) Comparison of the acid stability of azithromycin and erythromycin A. J Antimicrob Chemother 25: 39–47. |
| [49] |
Loke ML, Ingerslev F, Halling-Sørensen B, et al. (2000) Stability of Tylosin A in manure containing test systems determined by high performance liquid chromatography. Chemosphere 40: 759–765. doi: 10.1016/S0045-6535(99)00450-6
|
| [50] |
Mordi MN, Pelta MD, Boote V, et al. (2000) Acid-catalyzed degradation of clarithromycin and erythromycin B: A comparative study using NMR spectroscopy. J Med Chem 43: 467–474. doi: 10.1021/jm9904811
|
| [51] |
Zhang Y, Liu X, Cui Y, et al. (2009) Aspects of Degradation Kinetics of Azithromycin in Aqueous Solution. Chromatographia 70: 67–73. doi: 10.1365/s10337-009-1116-x
|
| [52] |
Voigt M, Savelsberg C, Jaeger M (2017) Photodegradation of the antibiotic spiramycin studied by high-performance liquid chromatography-electrospray ionization-quadrupole time-of-flight mass spectrometry. Toxicol Environ Chem 99: 624–640. doi: 10.1080/02772248.2017.1280039
|
| [53] | Laidler KJ, Chemical Kinetics. (Harper & Row, 1987). |
| [54] |
Tong L, Li P, Wang Y, et al. (2009) Analysis of veterinary antibiotic residues in swine wastewater and environmental water samples using optimized SPE-LC/MS/MS. Chemosphere 74: 1090–1097. doi: 10.1016/j.chemosphere.2008.10.051
|
| [55] | Batchu SR, Panditi VR, O'Shea KE, et al. (2014) Photodegradation of antibiotics under simulated solar radiation: implications for their environmental fate. Sci Total Environ 470–471: 299–310. |
| [56] |
Alatrache A, Laoufi NA, Pons MN, et al. (2010) Tylosin abatement in water by photocatalytic process. Water Sci Technol 62: 435–441. doi: 10.2166/wst.2010.928
|
| [57] |
Tassalit D, Laoufi AN, Bentahar F (2011) Photocatalytic Deterioration of Tylosin in an Aqueous Suspension Using UV/TiO2. Sci Adv Mater 3: 944–948. doi: 10.1166/sam.2011.1243
|
| [58] | Laoufi NA, Hout S, Tassalit D, et al. (2013) Removal of a Persistent Pharmaceutical Micropollutant by UV/TiO2 Process Using an Immobilized Titanium Dioxide Catalyst: Parametric Study. Chem Eng Trans 32: 1951–1956. |
| [59] |
Hansen JL, Ippolito JA, Ban N, et al. (2002) The structures of four macrolide antibiotics bound to the large ribosomal subunit. Mol Cell 10: 117–128. doi: 10.1016/S1097-2765(02)00570-1
|
| [60] |
Niu X, Glady-croué J, Croué J (2017) Photodegradation of sulfathiazole under simulated sunlight: Kinetics, photo-induced structural rearrangement, and antimicrobial activities of photoproducts. Water Res 124: 576–583. doi: 10.1016/j.watres.2017.08.019
|
| [61] | Hain E, Wammer KH, Blaney L (2018) Comment on "Photodegradation of sulfathiazole under simulated sunlight : Kinetics, photo-induced structural rearrangement, and antimicrobial activities of photoproducts". Water Res 131: 205–207. |
Figures(2) / Tables(6)

Melanie Voigt, Indra Bartels, Anna Nickisch-Hartfiel, Martin Jaeger. Elimination of macrolides in water bodies using photochemical oxidation[J]. AIMS Environmental Science, 2018, 5(5): 372-388. doi: 10.3934/environsci.2018.5.372


 DownLoad: