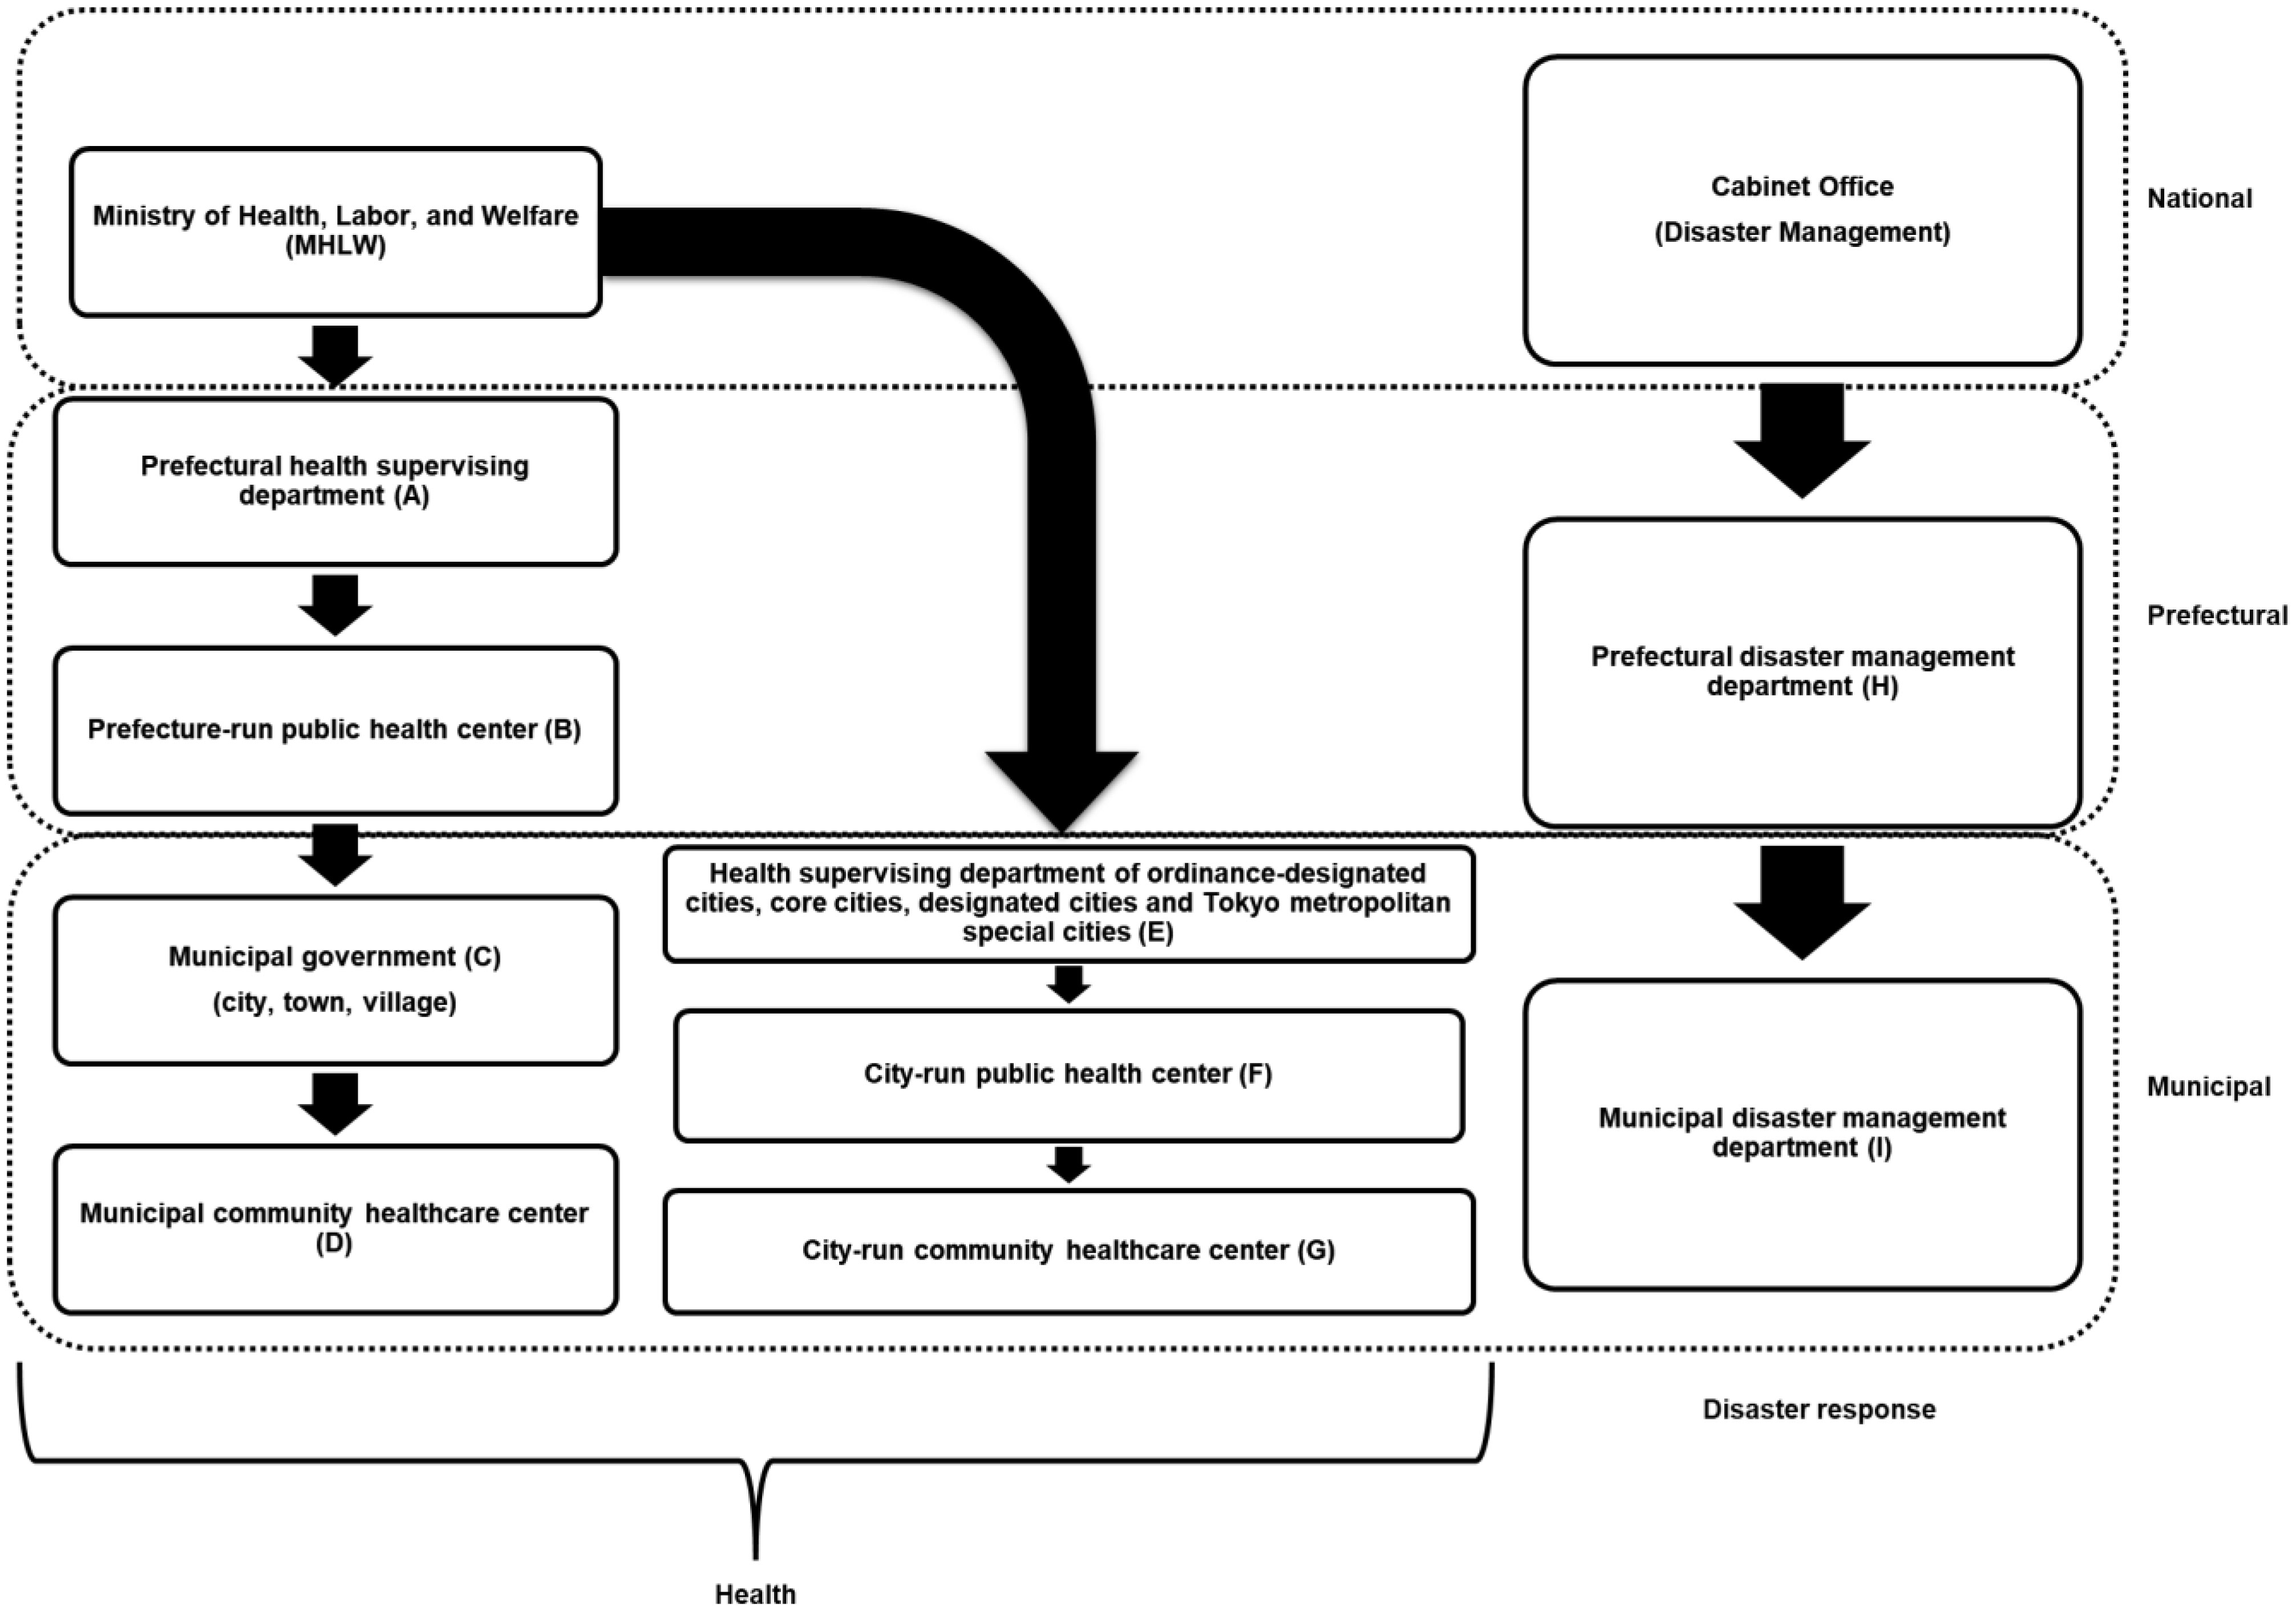
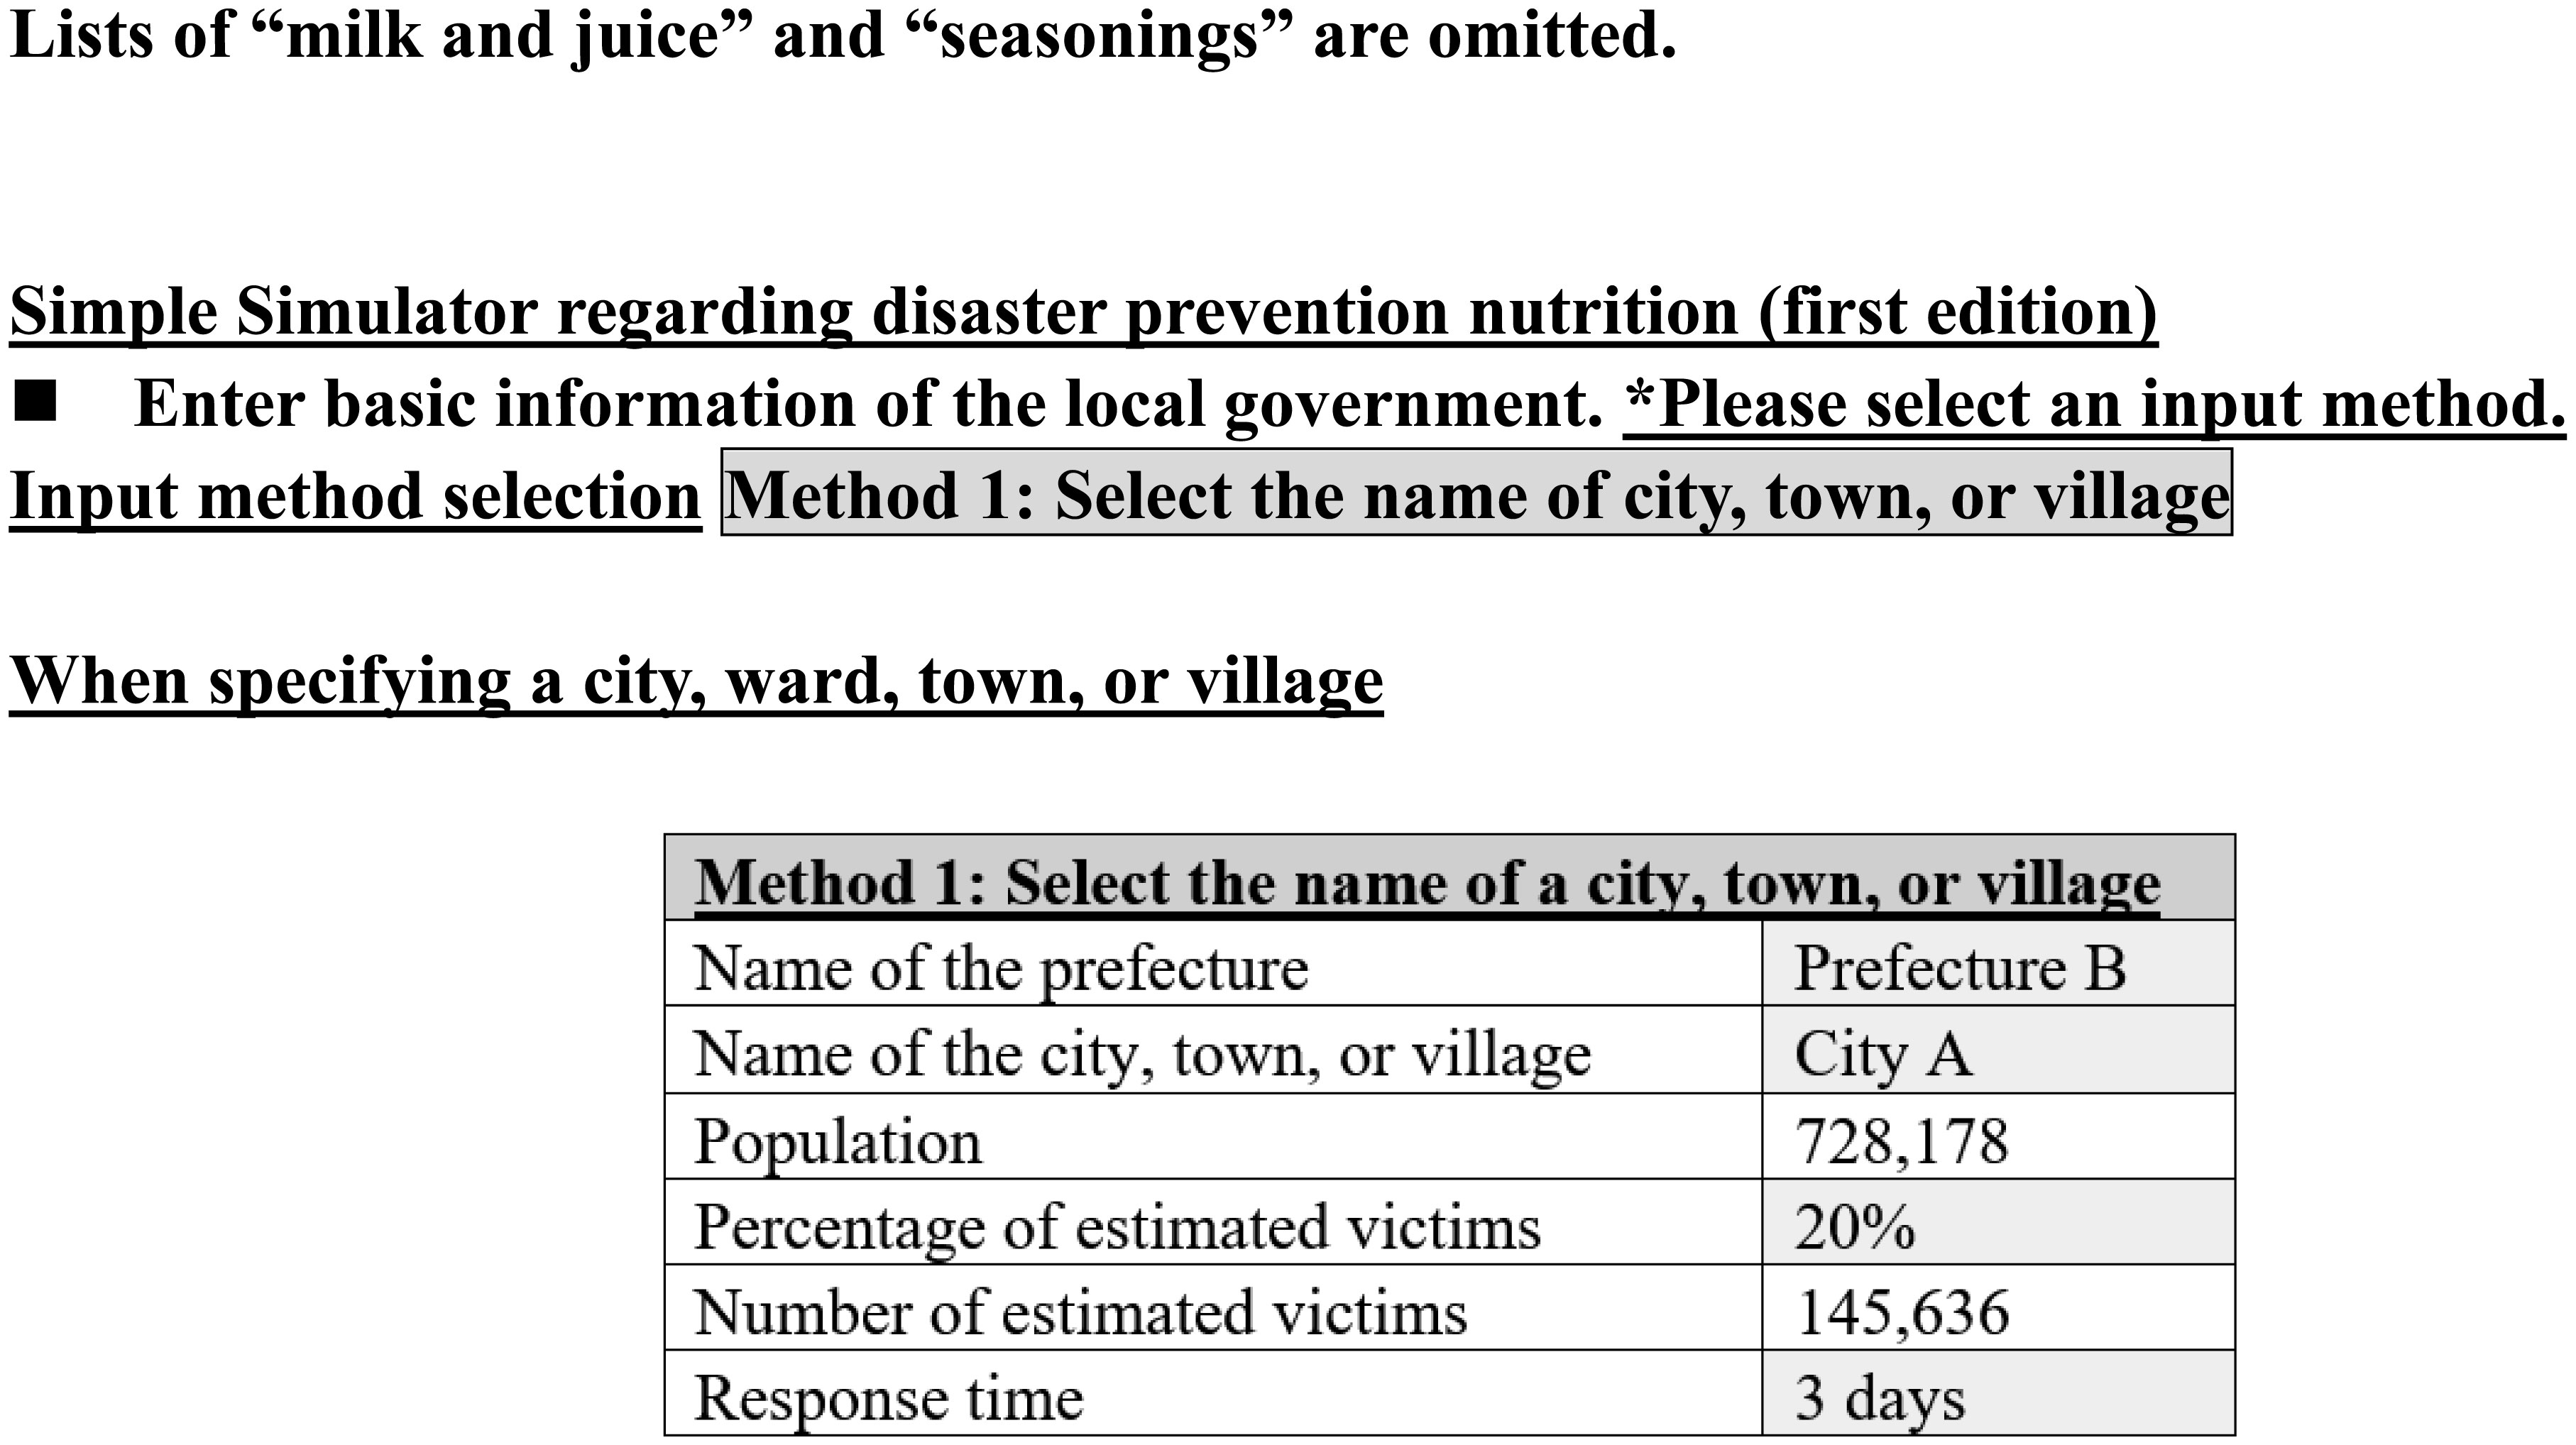
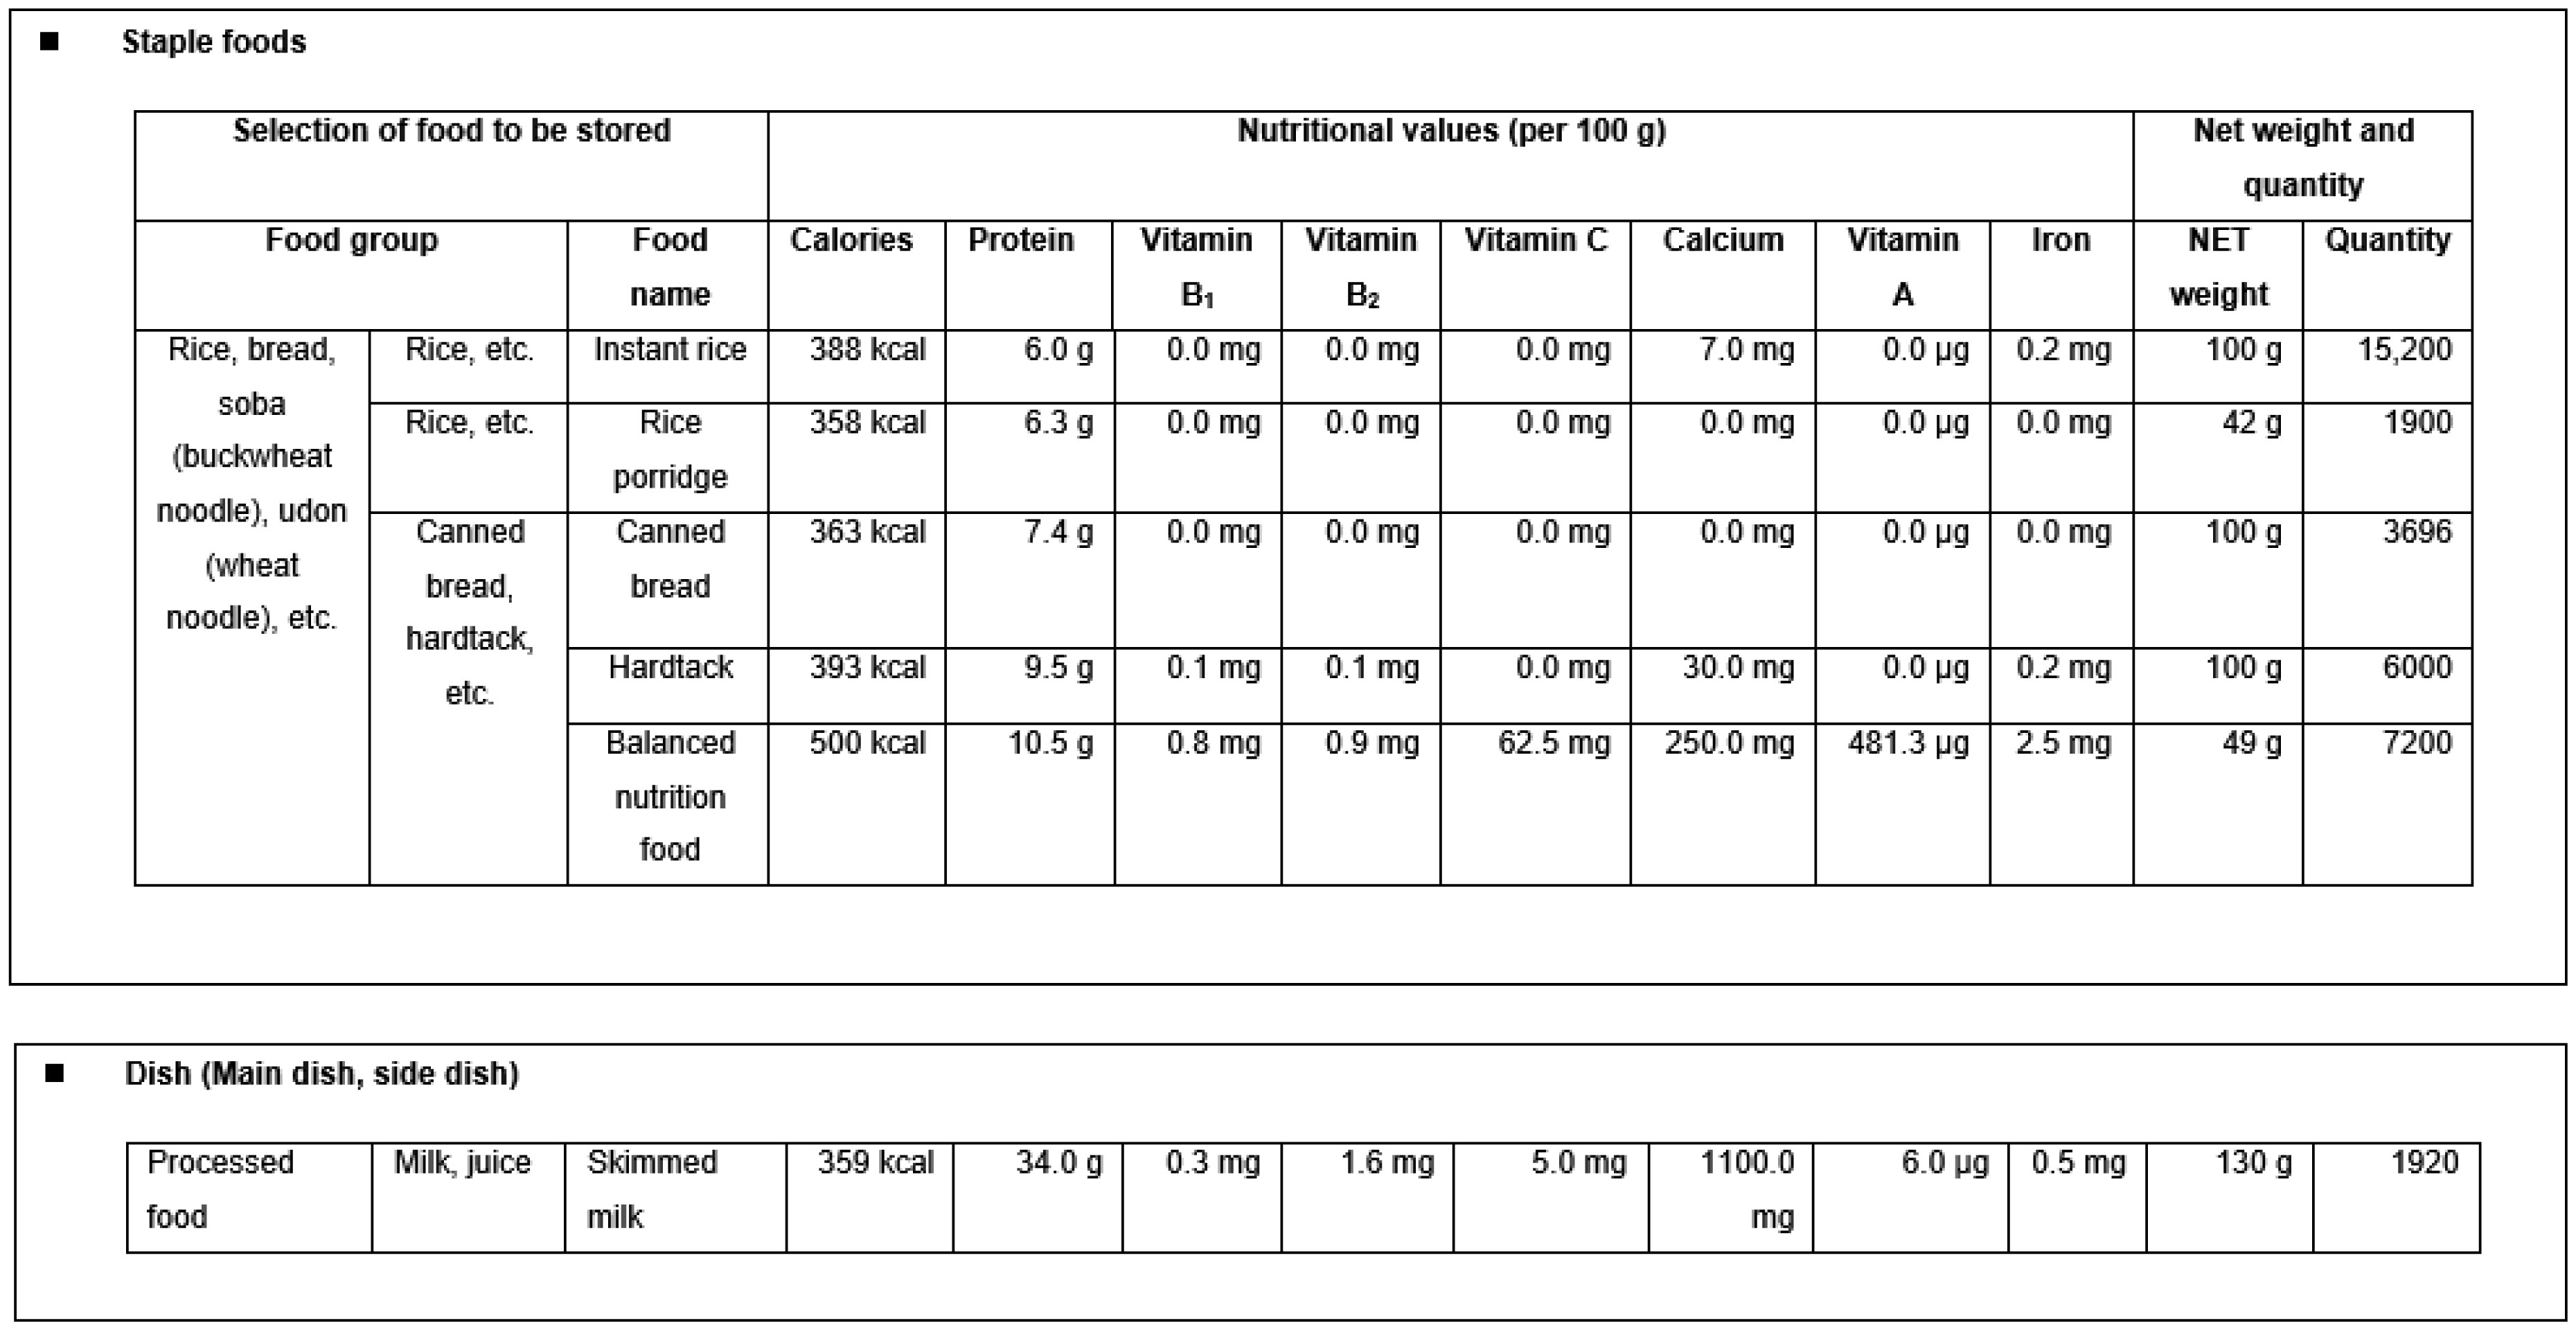
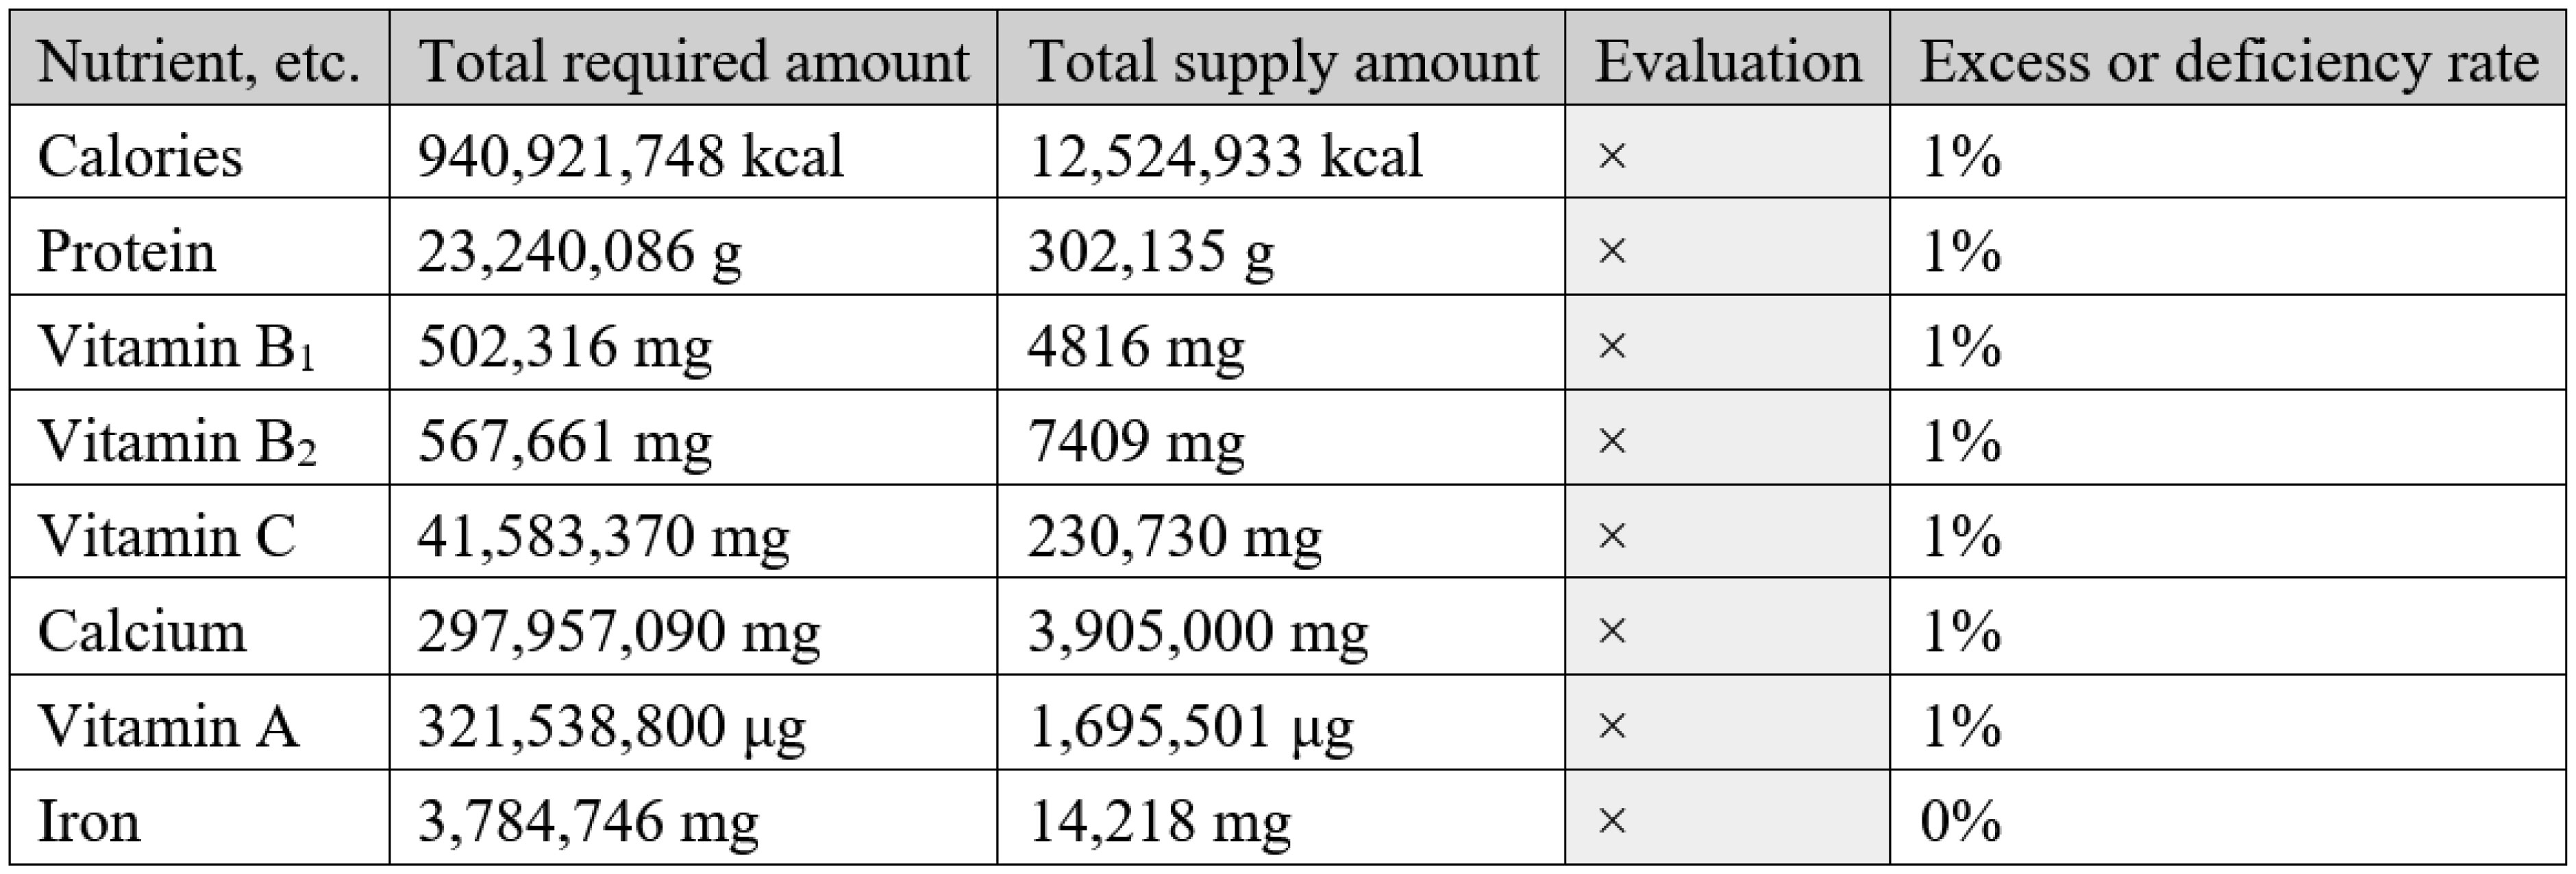
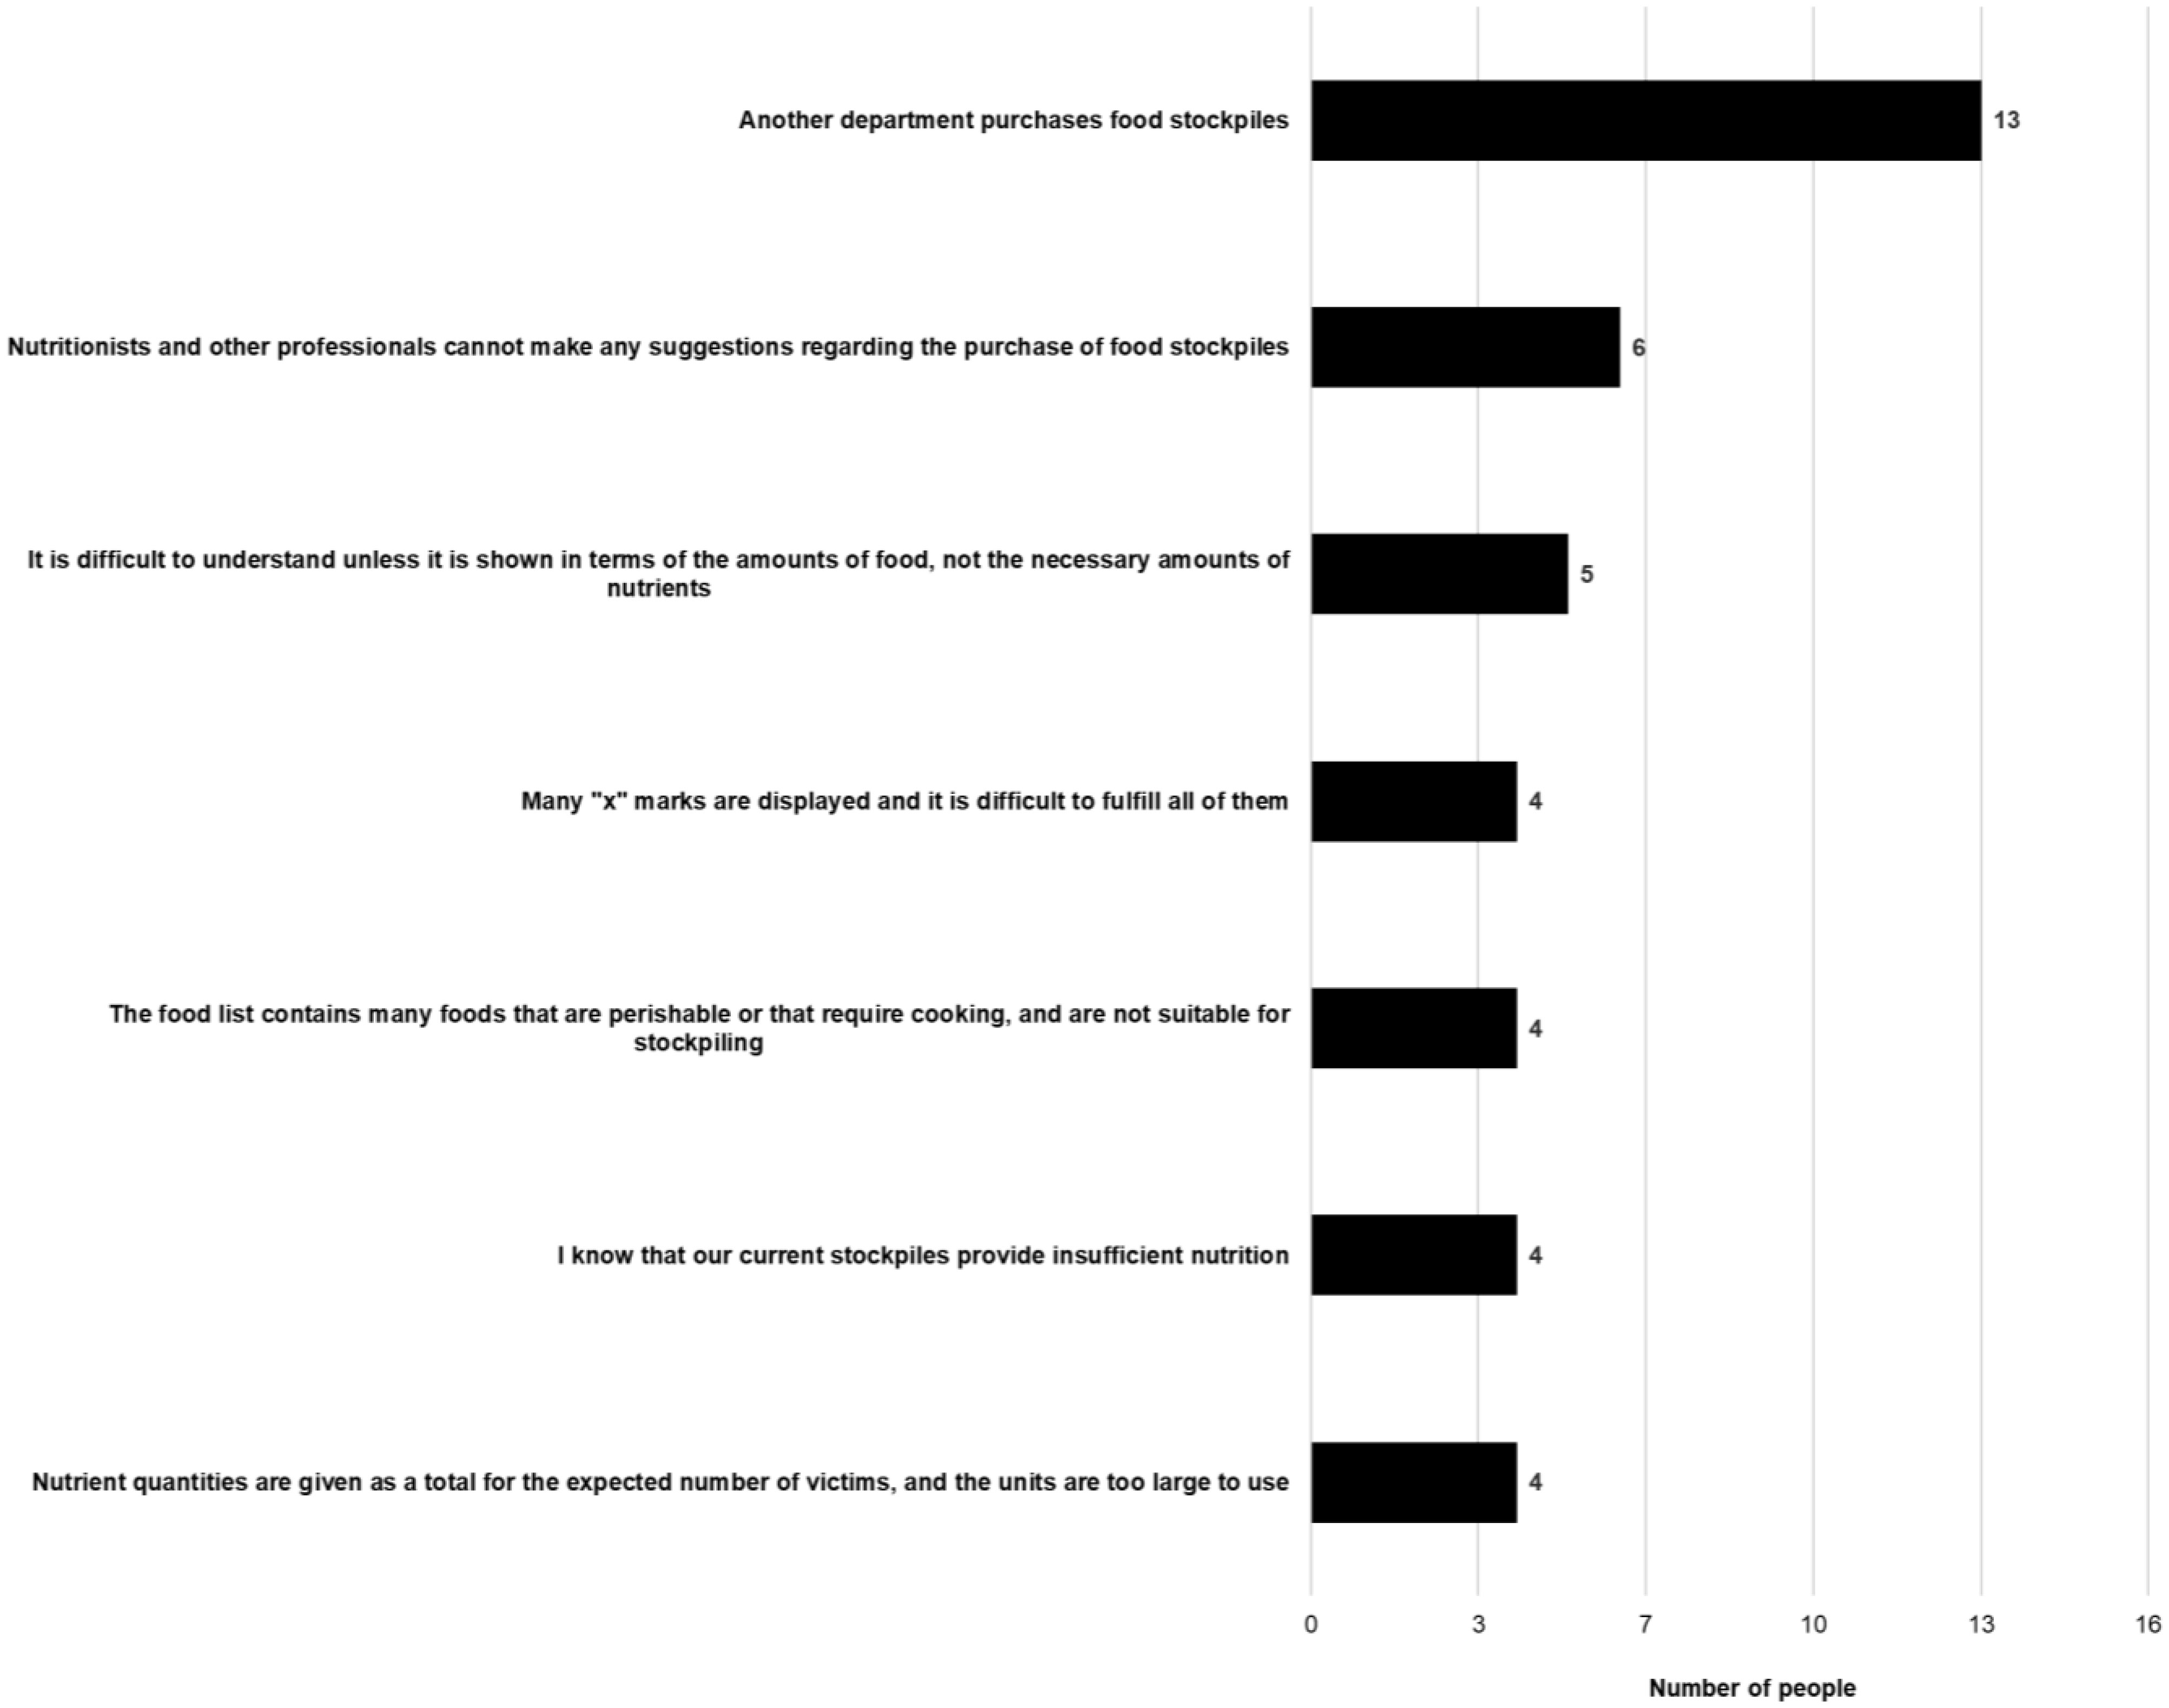
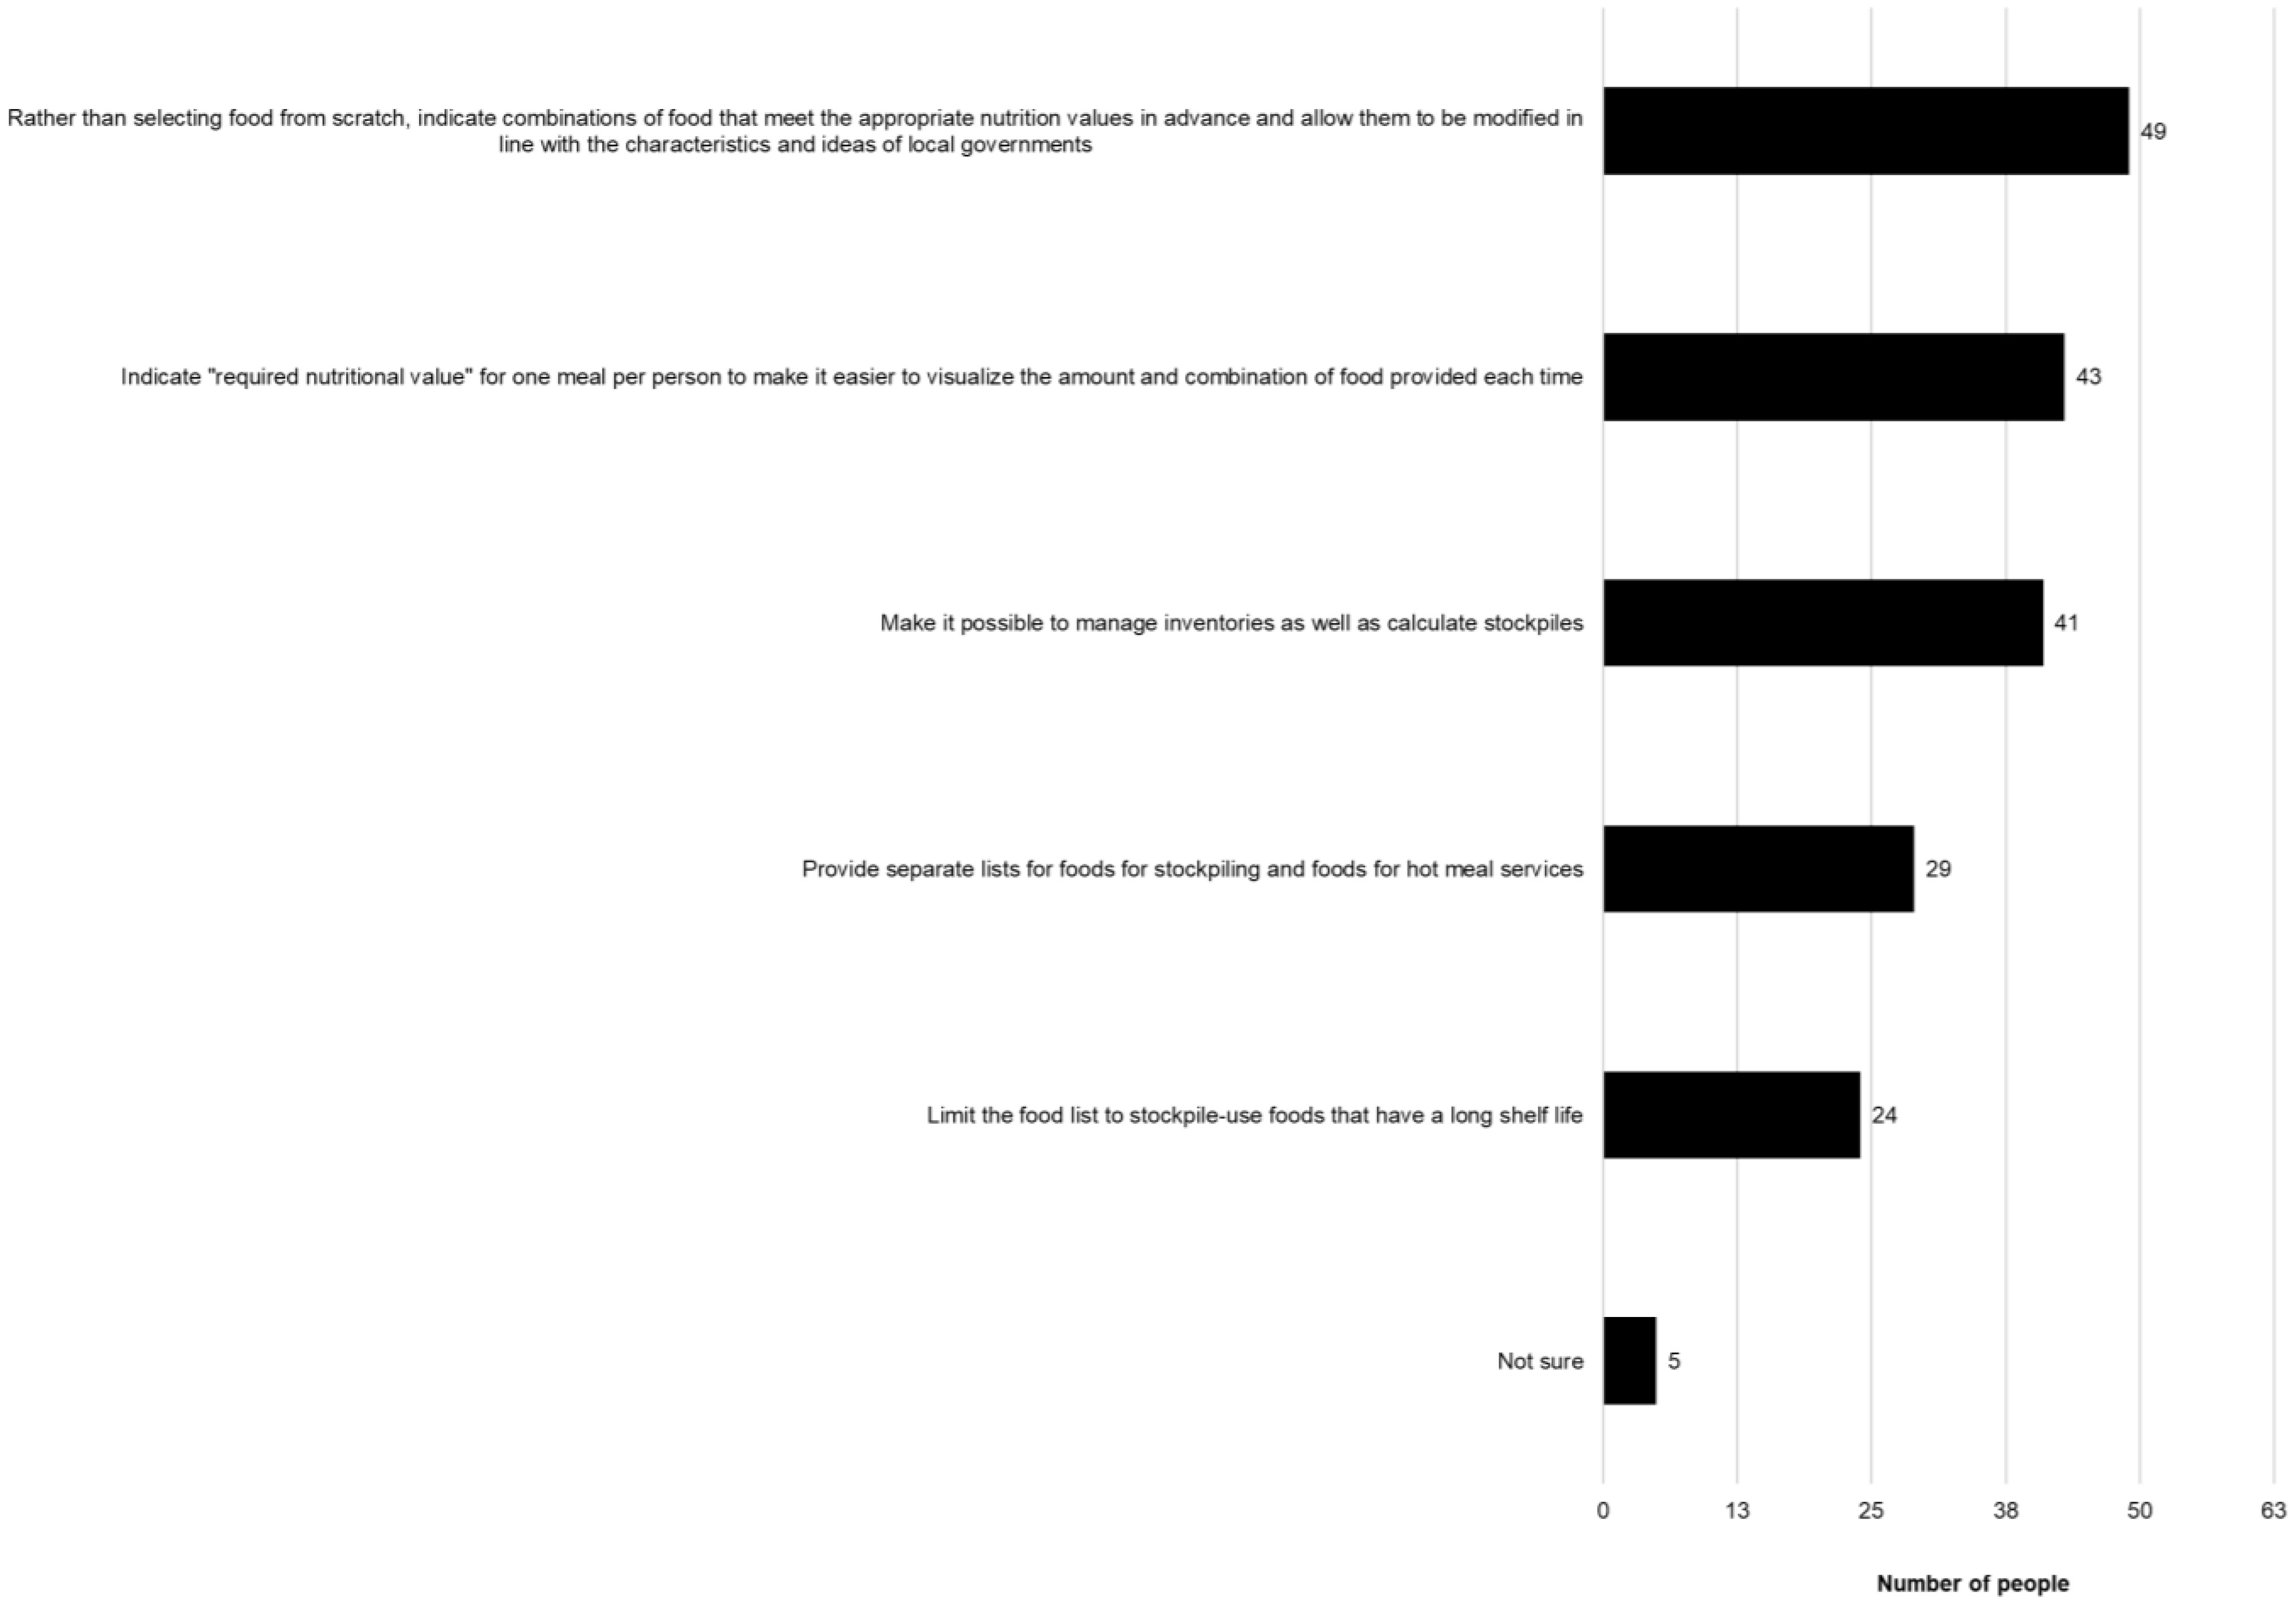
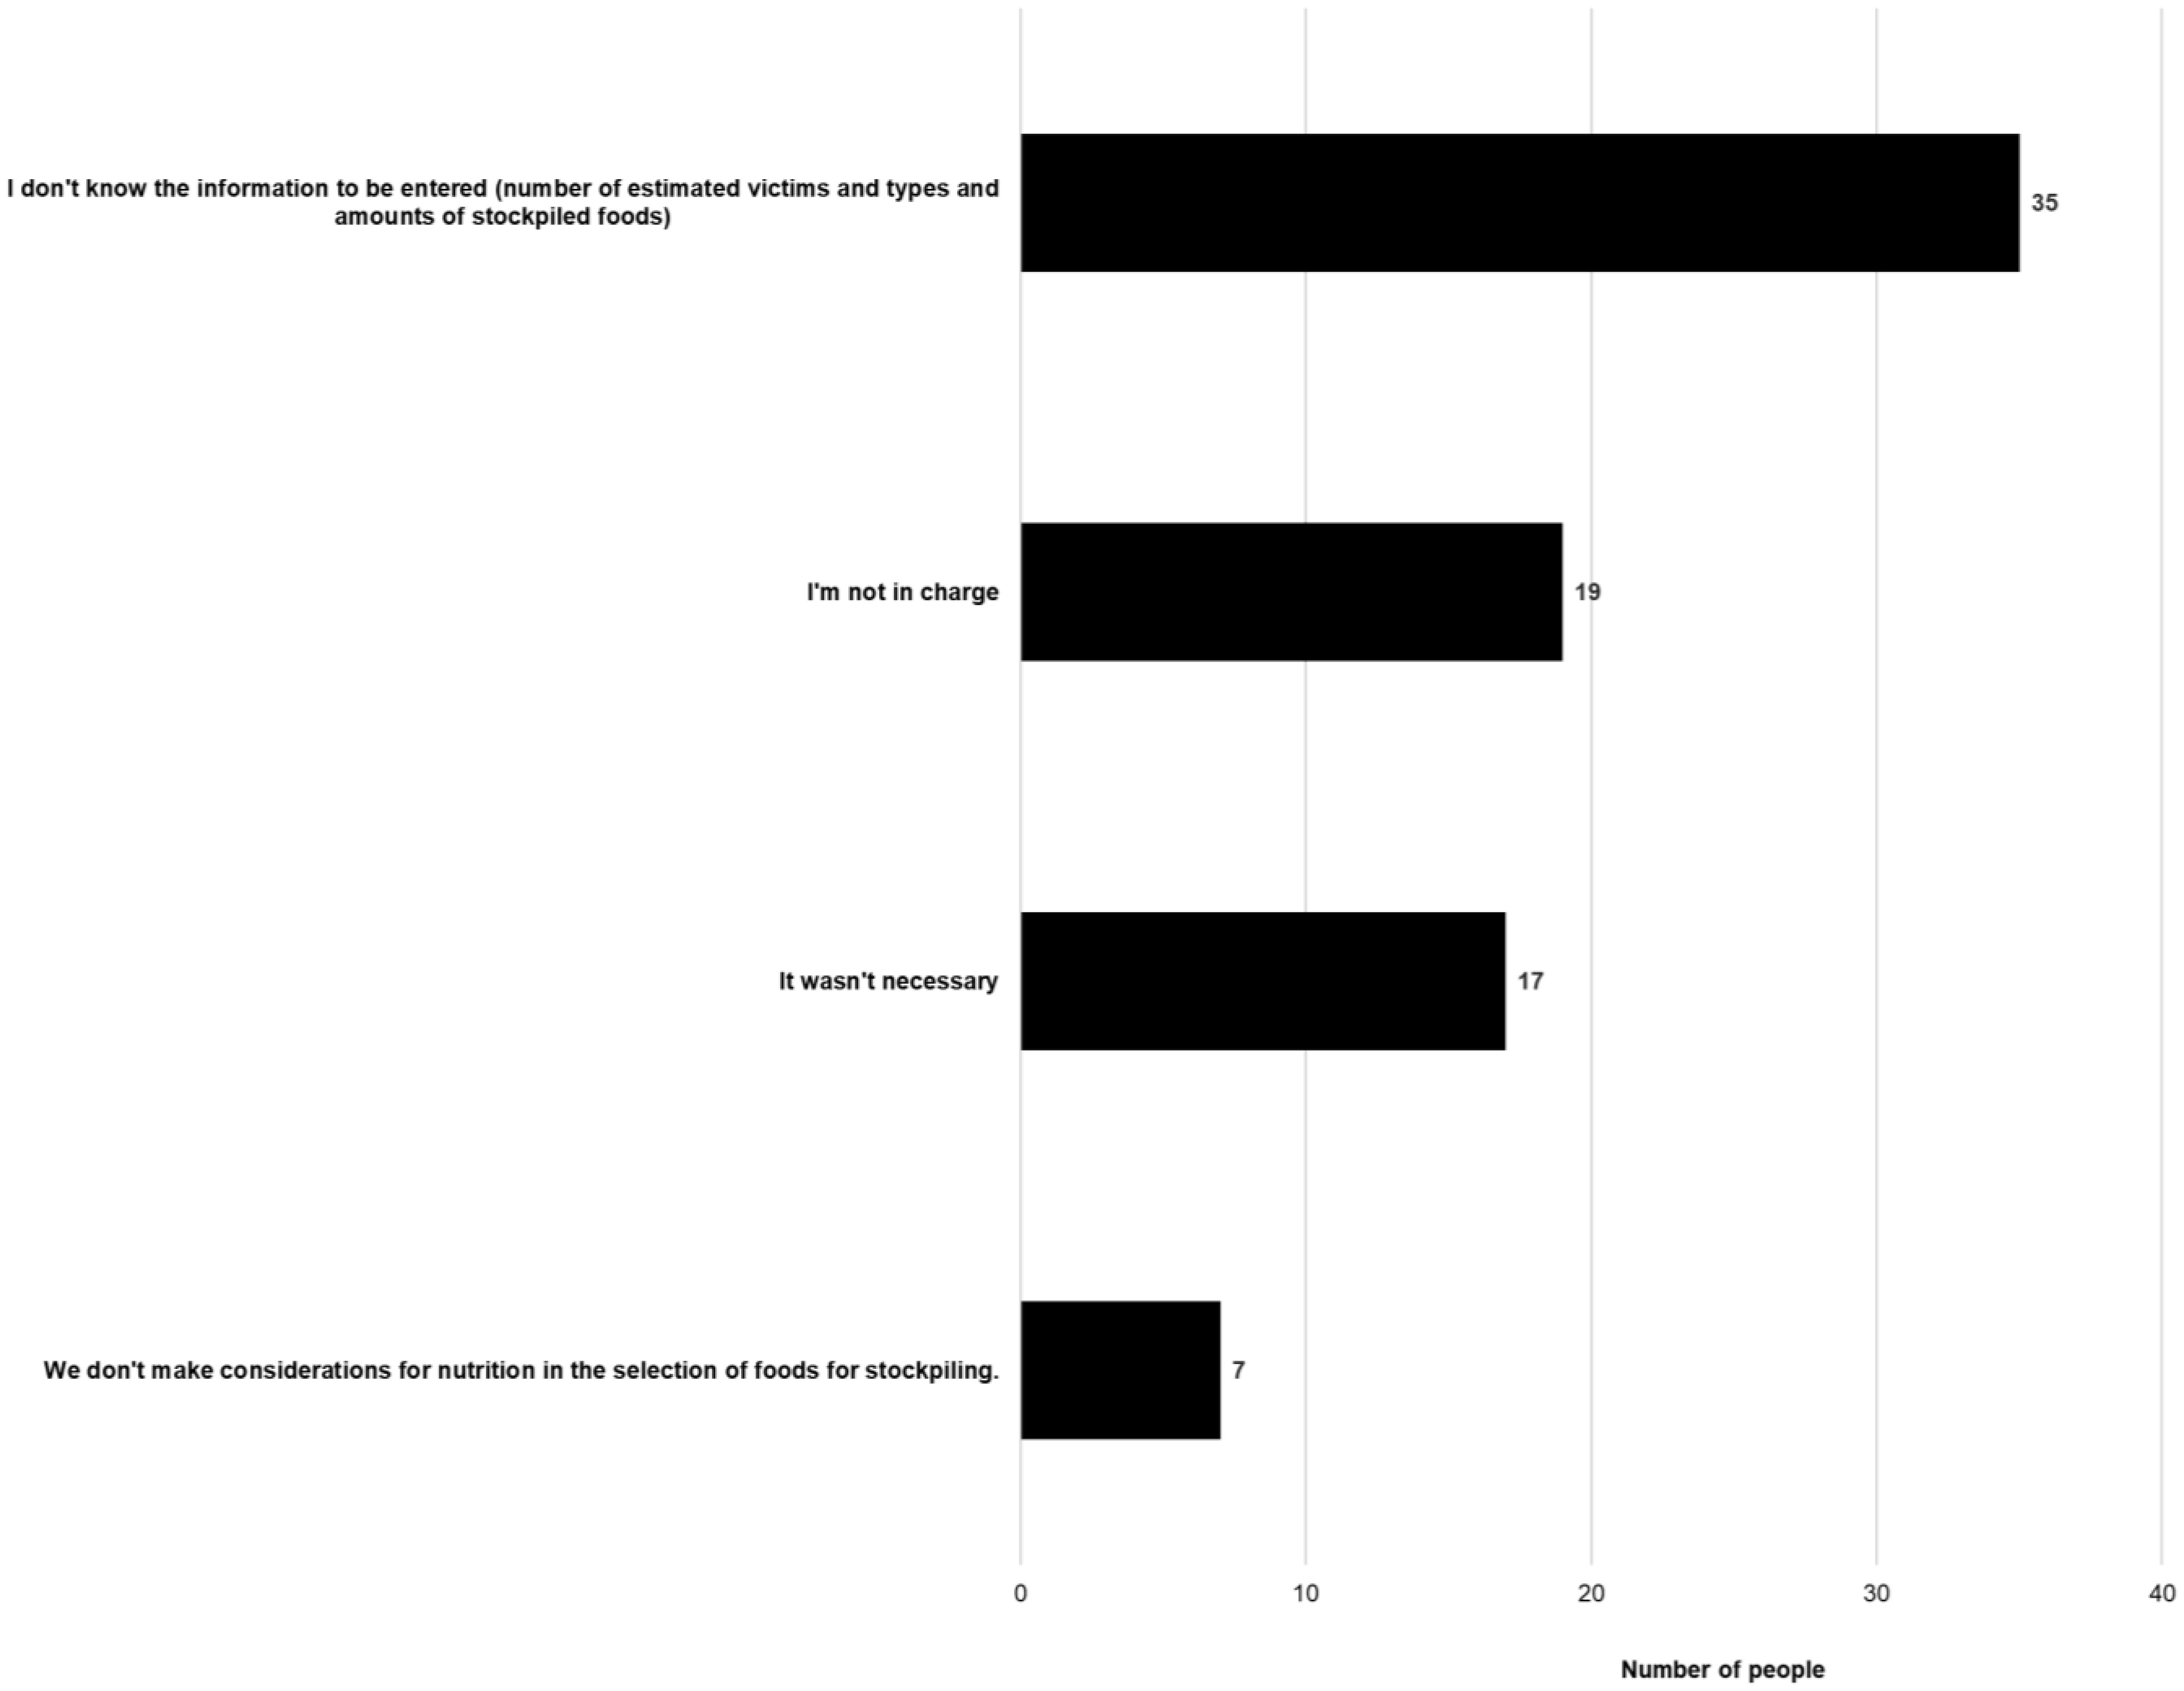
The Japanese Ministry of Health, Labour and Welfare compiled an Excel sheet — “Simple simulator for calculating nutritional food stocks in preparation for large-scale disasters” (Simulator). We examined the level of recognition and use of the Simulator by local governments and identified the points for its improvement. In stage 1, we surveyed local government personnel who participated in the “Workshop for nutrition assistance during large-scale disasters” held in November 2020 (n = 458; 313 responded) with an online questionnaire on the use of the Simulator and associated issues. Stage 2 involved group interviews with 15 public health dietitians who had been involved in food assistance during past natural disasters to identify points for improving the Simulator and the problems with food assistance during natural disasters. In stage 1, 233 responders (74.4%) confirmed their awareness of the existence of the Simulator. While 85 individuals (36.6%) used the Simulator, 63 individuals (74.1%) confirmed that they would use it in the future to plan and evaluate local government stocks. In stage 2, multiple comments regarding the Simulator's applicability and improvement in a realistic situation were collected. In order for the administrative staff in charge of disaster management to understand the nutritional importance of stockpiling main/side dishes, it was suggested that specific combinations of foods that meet the required amounts should be shown and that visualization using food products and the number of people covered by stockpiled foods may be easier to understand than pure nutritional values.
Citation: Noriko Sudo, Nobuyo Tsuboyama-Kasaoka, Ikuko Shimada, Keiichi Sato, Akiko Kubo. Attitudes toward using “Simple simulator for calculating nutritional food stocks in preparation for large-scale disasters” among local governmental personnel and public health dietitians in Japan: An explanatory mixed methods study[J]. AIMS Public Health, 2022, 9(4): 734-757. doi: 10.3934/publichealth.2022051
The Japanese Ministry of Health, Labour and Welfare compiled an Excel sheet — “Simple simulator for calculating nutritional food stocks in preparation for large-scale disasters” (Simulator). We examined the level of recognition and use of the Simulator by local governments and identified the points for its improvement. In stage 1, we surveyed local government personnel who participated in the “Workshop for nutrition assistance during large-scale disasters” held in November 2020 (n = 458; 313 responded) with an online questionnaire on the use of the Simulator and associated issues. Stage 2 involved group interviews with 15 public health dietitians who had been involved in food assistance during past natural disasters to identify points for improving the Simulator and the problems with food assistance during natural disasters. In stage 1, 233 responders (74.4%) confirmed their awareness of the existence of the Simulator. While 85 individuals (36.6%) used the Simulator, 63 individuals (74.1%) confirmed that they would use it in the future to plan and evaluate local government stocks. In stage 2, multiple comments regarding the Simulator's applicability and improvement in a realistic situation were collected. In order for the administrative staff in charge of disaster management to understand the nutritional importance of stockpiling main/side dishes, it was suggested that specific combinations of foods that meet the required amounts should be shown and that visualization using food products and the number of people covered by stockpiled foods may be easier to understand than pure nutritional values.
Dietary Reference Intakes
Ministry of Health, Labour and Welfare

| [1] | Ministry of Health, Labour and WelfareNutrition Policy in Japan to Leave No One Behind: For Achieving Sustainable Societies (2003). Available from: https://www.mhlw.go.jp/content/000700858.pdf. |
| [2] |
Fuse A, Igarashi Y, Tanaka T, et al. (2011) Onsite medical rounds and fact-finding activities conducted by Nippon Medical School in Miyagi Prefecture after the Great East Japan Earthquake 2011. J Nippon Med Sch 78: 401-404. https://doi:10.1272/jnms.78.401 
|
| [3] |
Zhang W, Ohira T, Abe M, et al. (2017) Evacuation after the Great East Japan Earthquake was associated with poor dietary intake: The Fukushima Health Management Study. J Epidemiol 27: 14-23. https://doi:10.1016.j.je.2016/08.002
|
| [4] |
Brodie M, Weltzien E, Altman D, et al. (2006) Experiences of Hurricane Katrina evacuees in Houston shelters: implications for future planning. Am J Public Health 96: 1402-1408. https://doi:10.2105/AJPH.2005.084475
|
| [5] |
Mizelle RM (2020) Hurricane Katrina, diabetes, and the meaning of resiliency. Isis 111: 120-128. https://doi.org/10.1086/707822
|
| [6] | Sato M, Nakamura Y, Atogami F, et al. (2016) Immediate needs and concerns among pregnant women during and after Typhoon Haiyan (Yolanda). PLoS Curr 25: 8. https://doi:10.1371/currents.dis.29e4c0c810b47d7fd8d0d1fb782892c |
| [7] |
Ozbay K, Ozguven EE (2007) Stochastic humanitarian inventory control model for disaster planning. Transport Res Record 2022: 63-75. https://doi:10.3141/2022-08
|
| [8] | Centre for Risk Studies, Cambridge World City Risk Atlas (2014). Available from: https://www.jbs.cam.ac.uk/wp-content/uploads/2020/08/crs-worldcityrisk2025-threathazardmaps.pdf?msclkid=00728bc0a9b211ec88a0552f9ecba7fb. |
| [9] | Cabinet OfficeAbout Countermeasures for An Earthquake That Directly Hits the Tokyo Metropolitan Area (2013). Available from: http://www.bousai.go.jp/jishin/syuto/taisaku_wg/pdf/syuto_wg_gaiyou.pdf. |
| [10] | The Japan Dietetic AssociationNatural Disaster Response Manual for Nurseries: Meal Provision (2013). Available from: https://www.dietitian.or.jp/data/guide/h25-1.pdf. |
| [11] |
Lassa JA, Teng P, Caballero-Anthonit M, et al. (2019) Revisiting emergency food reserve policy and practice under disaster and extreme climate events. Int J Disast Risk Sci 10: 1-13. https://doi:10.1007/s13753-018-0200-y
|
| [12] |
Lentz EC, Barrett CB (2013) The economics and nutritional aspects of food assistance policies and programs. Food Pol 42: 151-163. https://doi:10.1016/j.foodpol.2013.06.011
|
| [13] | Webb P, Rogers BL, Rosenberg I, et al. (2011) Improving the nutritional quality of U.S. food aid: recommendations for changes to products and programs. Boston, MA: Tufts University. |
| [14] |
Sato M, Nakano M, Gatto K, et al. (2016) Nutritional and environmental considerations of food stockpiles in Japan and USA: reducing food waste by efficient reuse through the food banks. Int J Sustain Dev Plann 11: 980-988. https://doi:10.2495/SDP-V11-N6-980-988
|
| [15] |
Colon-Ramos U, Roess AA, Robien K, et al. (2019) Foods distributed during federal disaster relief response in Puerto Rico after Hurricane Maria did not fully meet federal nutrition recommendations. J Acad Nutr Diet 119: 1903-1915. https://doi:10.1016/j.jand.2019.03.015
|
| [16] |
Kumamoto H, Murata M, Sasaki Y, et al. (2013) Nutritional support for prevention of secondary disaster: the role of processed food in disaster situations: report from the disaster prevention forum at the Japanese Society for Food Science and Technology 59th Annual Conference. Nippon Shokuhin Kagaku Kogaku Kaishi 60: 679-686. https://doi:10.3136/nskkk.60.679
|
| [17] | Ministry of Health, Labour and WelfareSimple Simulator for Calculating Nutritional Food Reserves in Preparation for Large-scale Disasters (2020). Available from: https://www.mhlw.go.jp/stf/seisakunitsuite/bunya/0000089299_00004.html. |
| [18] | Sudo N (2011) Characteristics of educational leaflets that attract pregnant women. Health Serv Insights 4: 1-10. https://doi/full/10.4137/HSI.S6572 |
| [19] |
Sudo N (2011) Developing an alcohol education leaflet for pregnant women using qualitative and quantitative data. Clin Med Insights: Women's Health 4: 17-33. https://doi:10.4137/CMWH.S6541
|
| [20] | Sudo N, Sawaguchi M, Yoshiike N (2012) A group interview concerning pre-graduate education about nutrition in emergencies in a registered dietitian training course. J Jpn Diet Assoc 55: 126-135. https://doi.org/10.11379/jjda.55.126 |
| [21] | Ito S, Sudo N, Fujiwara Y (2014) A group interview regarding disaster preparedness for food assistance in a university that offers a training course for registered dietitians. Health Serv Insights 7: 13-18. https://doi.org/10.4137/HSI.S13433 |
| [22] | Amitani Y, Sudo N, Tsuboyama-Kasaoka N, et al. (2014) Restructuring of the disaster countermeasures about meal services at nursery schools in a metropolitan area after the Great East Japan Earthquake. J Jpn Diet Assoc 57: 192-200. https://doi.org/10.11379/jjda.57.192 |
| [23] | Amitani Y, Sudo N, Tsuboyama-Kasaoka N, et al. (2017) Meal services after the Great East Japan Earthquake at nursery schools in a tsunami-affected town: focus group observations. Asia Pac J Clin Nutr 26: 308-312. https://doi.org/10.6133/apjcn.012016.05 |
| [24] | Thorne S (2016) Interpretive description: qualitative research for applied practice. New York: Routledge. https://doi.org/10.4324/9781315545196 |
| [25] | Sato T, Kasuga H, Kanzaki M (2019) Mapping of qualitative research methods. Tokyo: Shin-yo-sha. |
| [26] | Kashima H (2022) Nutrition Policy. Public Health Nutrition for Wellness . Tokyo: Ishiyaku Publishers 52-104. |
| [27] | Sudo N, Sawaguchi M, Yoshiike N (2011) National survey regarding preparations of cities, towns and villages for nutrition and food support during disasters, and technical support from healthcare centers. Jpn J Public Health 58: 895-902. https://doi.org/10.11236/jph.58.10_895 |
| [28] | Nakamura K, Okamoto T (2019) Disaster relief business handbook for local government staff: from preparations, initial response and first-aid to recovery and reconstruction. Tokyo: Daichi Hoki Shuppan. |
| [29] |
Ueda Y, Sudo N, Tsuboyama-Kasaoka N, et al. (2016) A nationwide survey on local governments' preparedness for nutrition assistance during natural disasters: involvement of administrative dietitians, mass feeding, and assistance for vulnerable residents. Jpn J Nutr Diet 74: 106-116. https://doi.org/10.5264/eiyogakuzashi.74.106
|
| [30] | Tsukui S (2020) Disaster case management guidebook. Tokyo: Godo Shuppan. |
| [31] | Cabinet OfficeAnnual Report on the Ageing Society [Summary] FY2021 (2021). Available from: https://www8.cao.go.jp/kourei/english/annualreport/2021/pdf/2021.pdf. |
| [32] | Sudo N (2017) Health issues among the elderly in disasters. JATAFF J 5: 43-46. |
| [33] | Sudo N (2017) What is essential quality of nursing care food?. Trends Nutr 2: 146-151. |
| [34] | Kubo A, Ohara N, Enshouiwa M, et al. (2020) A nationwide survey on nutritional assistance and preparation measures adopted by municipal registered dietitians during large-scale disasters. Jpn J Public Health 67: 344-355. https://doi.org/10.11236/jph.67.5_344 |
| [35] | Sudo N, Sawaguchi M, Yoshiike N (2010) Changes in food intakes and required nutrients under stress: to support disaster victims with food assistance. J Jpn Diet Assoc 53: 349-355. https://doi.org/10.11379/jjda.53.349 |
| [36] | Kozaki N, Sudo N, Takeda E (2017) Thought and evaluation for stockpiled foods by the female university students who spent two days eating stockpiled foods. J Jpn Disast Food Soc 5: 19-30. |
| [37] | Takeda E, Sudo N, Kozaki N (2018) Evaluation of a university's stockpiled foods by students who lived on them alone for two days. J Jpn Disast Food Soc 5: 29-37. |
| [38] | Hiraishi M, Sudo N, Tsuboyama-Kasaoka N, et al. How we can improve our meal planning tool in disasters: using “NutVal” of the United Nations High Commissioner for Refugees as a reference, Jpn Disast Food Soc 2020 Academic Conference, Summary of Presentations, 15 (2020). |
Figures(7) / Tables(5)

Noriko Sudo, Nobuyo Tsuboyama-Kasaoka, Ikuko Shimada, Keiichi Sato, Akiko Kubo. Attitudes toward using “Simple simulator for calculating nutritional food stocks in preparation for large-scale disasters” among local governmental personnel and public health dietitians in Japan: An explanatory mixed methods study[J]. AIMS Public Health, 2022, 9(4): 734-757. doi: 10.3934/publichealth.2022051


 DownLoad: