In this study, a survey was conducted to determine the public opinion regarding the acceptance of using home composters as an alternative approach for household organic waste management. This approach is introduced as a method to replace the landfilling of organic municipal solid waste, which is the main solid waste management currently employed in Palestine, considering Anabta town as a case study. The results showed that people in the target area are welcoming of the home composting idea, and about 99% of participants are interested in owning home composters at their properties, which is regarded as a good reference for implementing the proposed home composting scheme in this area. The results showed that people are interested in the new proposed scheme for organic household waste despite their minimal knowledge and understanding about the composting process's importance and effects. The survey tested the people's expectations and thoughts about the home composting concept and found that the main motives for home composting were reducing the cost of house gardening and using the produced compost in soil nutrition, besides being part of environmental sustainability. On the other side, obstacles were due to people's inexperience of the home composting method, as almost half of participants were expecting an exhausting, long process to produce compost, with the related bad smell and insects during composting progression. Hence, the study found that it is important to spread awareness about the right procedures to apply home composting among participants, in line with environmental awareness campaigns through social media, and provide personalized follow-up with participants.
Citation: Tahseen Sayara, Ruba Hanoun, Yamen Hamdan. Survey on the factors and social perspectives to participate in home composting schemes in Palestine: Anabta case study[J]. AIMS Environmental Science, 2022, 9(3): 232-243. doi: 10.3934/environsci.2022016
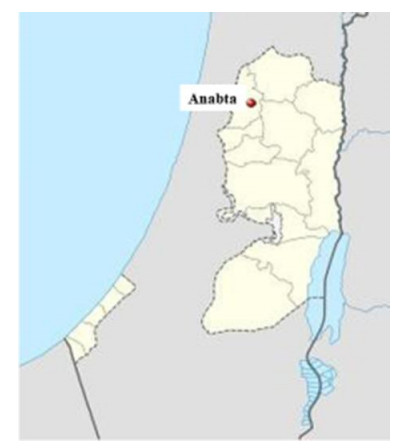
In this study, a survey was conducted to determine the public opinion regarding the acceptance of using home composters as an alternative approach for household organic waste management. This approach is introduced as a method to replace the landfilling of organic municipal solid waste, which is the main solid waste management currently employed in Palestine, considering Anabta town as a case study. The results showed that people in the target area are welcoming of the home composting idea, and about 99% of participants are interested in owning home composters at their properties, which is regarded as a good reference for implementing the proposed home composting scheme in this area. The results showed that people are interested in the new proposed scheme for organic household waste despite their minimal knowledge and understanding about the composting process's importance and effects. The survey tested the people's expectations and thoughts about the home composting concept and found that the main motives for home composting were reducing the cost of house gardening and using the produced compost in soil nutrition, besides being part of environmental sustainability. On the other side, obstacles were due to people's inexperience of the home composting method, as almost half of participants were expecting an exhausting, long process to produce compost, with the related bad smell and insects during composting progression. Hence, the study found that it is important to spread awareness about the right procedures to apply home composting among participants, in line with environmental awareness campaigns through social media, and provide personalized follow-up with participants.

| [1] | Maina S, Kachrimanidou V, Koutinas A (2017) A roadmap towards a circular and sustainable bioeconomy through waste valorization. Curr Opin Green Sustain Chem 8: 18-23. |
| [2] | Soobhany N (2019) Insight into the recovery of nutrients from organic solid waste through biochemical conversion processes for fertilizer production: A review. J Clean Prod 241: 118413. |
| [3] | Colón J, Martínez-Blanco J, Gabarrell X, et al. (2010) Environmental assessment of home composting. Resour Conserv Recycl 54: 893-904. |
| [4] | Li Z, Lu H, Ren L, et al. (2013) Experimental and modelling approaches for food waste composting. Chemosphere 93: 1247-1257. |
| [5] | Sayara T, Basheer-Salimia R, Hawamde F, et al. (2020) Recycling of organic wastes through composting: Process performance and compost application in agriculture. Agronomy 10: 1838. |
| [6] | Martínez-Blanco J, Colón J, Gabarrell X, et al. (2010) The use of life cycle assessment for the comparison of biowaste composting at home and full scale. Waste Manage 30: 983-994. |
| [7] | Andersen J, Boldrin A, Christensen T, et al. (2011) Mass balances and life cycle inventory of home composting of organic waste. Waste Manag 31: 1934-1942. |
| [8] | Vázquez MA, Soto M (2017) The efficiency of home composting programmes and compost quality. Waste Manag 64: 39-50. |
| [9] | Tatàno F, Pagliaro G, Di Giovanni P, et al. (2015) Biowaste home composting: experimental process monitoring and quality control. Waste Manag Apr 38: 72-85. |
| [10] | CESVI (2019) Solid waste management in the occupied Palestinian territory, West Bank including East Jerusalem & Gaza, Overview Report. |
| [11] | Palestinian Central Bureau of Statistics (2021) Labour Force Survey: (October- December, 2020) Round, (Q4/2020). "Press Report Labour Force Survey. Ramallah - Palestine. |
| [12] | Al-Sari MI, Sarhan MAA, Al-Khatib IA (2018) Assessment of compost quality and usage for agricultural use: a case study of Hebron, Palestine. Environ Monit Assess 190: 223. |
| [13] | Fadhullah W, Imran NIN, Ismail SNS, . et al. (2022) Household solid waste management practices and perceptions among residents in the East Coast of Malaysia. BMC Public Health 22: 1. |
| [14] | Fan B, Yang W, Shen X (2019) A comparison study of 'motivation-intention-behavior' model on household solid waste sorting in China and Singapore. J Clean Prod 211: 442-454. |
| [15] | Chen MF, Tung PJ (2010) The moderating effect of perceived lack of facilities on consumers' recycling intentions. Environ Behav 42: 824-844. |
| [16] | Yuan Y, Nomura H, Takahashi Y, Yabe M (2016) Model of Chinese household kitchen waste separation behavior: A case study in Beijing city. Sustainability 8: 1083. |
| [17] | Matter A, Dietschi M, Zurbrügg C (2013) Improving the informal recycling sector through segregation of waste in the household- The case of Dhaka Bangladesh. Habitat International 38: 150-156. |
| [18] | Thanh NP, Matsui Y (2012) An evaluation of alternative household solid waste treatment practices using life cycle inventory assessment mode. Environ Monit Assess 184: 3515-3527. |
| [19] | Suleman Y, Darko ET, Agyemang-Duah W (2015) Solid waste disposal and community health implications in Ghana: Evidence from Sawaba, Asokore Mampong Municipal Assembly. J Civil Environ Eng 5: 1-6. |
| [20] | Karim Ghani WA, Rusli IF, Biak DR, et al. (2013) An application of the theory of planned behaviour to study the influencing factors of participation in source separation of food waste. Waste Manag. 33: 1276-1281. |
| [21] | Petrescu-Mag RM, Petrescu DC, Azadi H (2020) A social perspective on soil functions and quality improvement: Romanian farmers' perceptions. Geoderma 380: 114573. |
| [22] | Mukherji SB, Sekiyama M, Mino T, et al. (2016) Resident knowledge and willingness to engage in waste management in Delhi. India Sustain 8: 1065. |
| [23] | Nanda S, Berruti F (2021) Municipal solid waste management and landfilling technologies: a review. Environ Chem Lett 19: 1433-1456. |
| [24] | Sayara T, Sánchez A (2020) Bioremediation of PAH-contaminated soils: Process enhancement through composting/compost. Appl Sci 10: 3684. |
| [25] | Rodić L, Wilson DC (2017) Resolving governance issues to achieve priority sustainable development goals related to solid waste management in developing countries. Sustainability 404 |
| [26] | Tot B, Srđević B, Vujić B, et al. (2016) Evaluation of key driver categories influencing sustainable waste management development with the analytic hierarchy process (AHP): Serbia example. Waste Manag Res 34: 740-747. |


Figures(5) / Tables(1)

Tahseen Sayara, Ruba Hanoun, Yamen Hamdan. Survey on the factors and social perspectives to participate in home composting schemes in Palestine: Anabta case study[J]. AIMS Environmental Science, 2022, 9(3): 232-243. doi: 10.3934/environsci.2022016


 DownLoad: