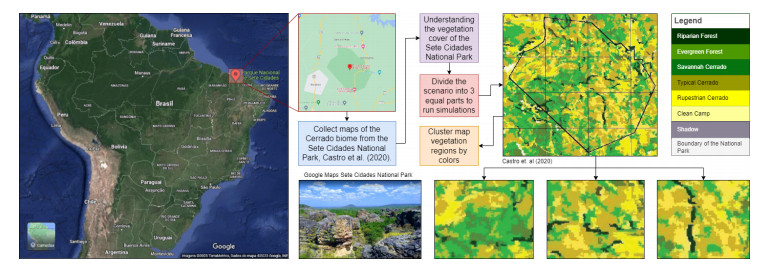
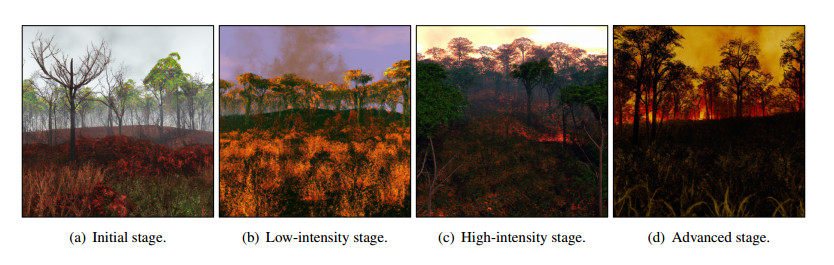
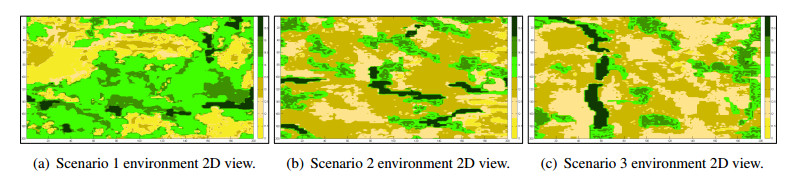
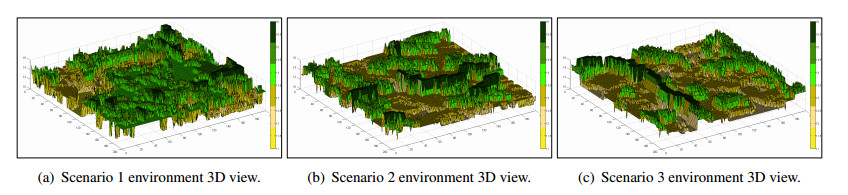
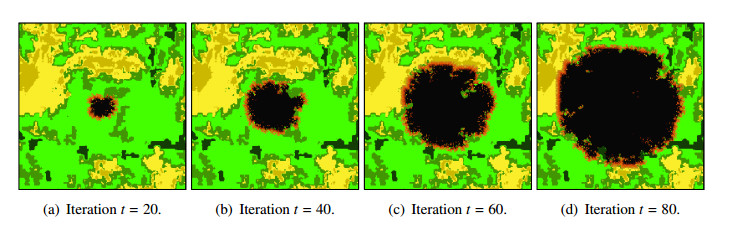
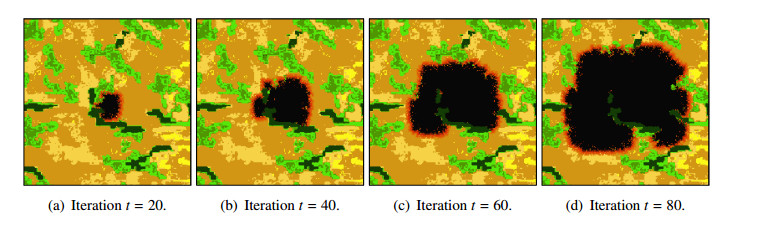
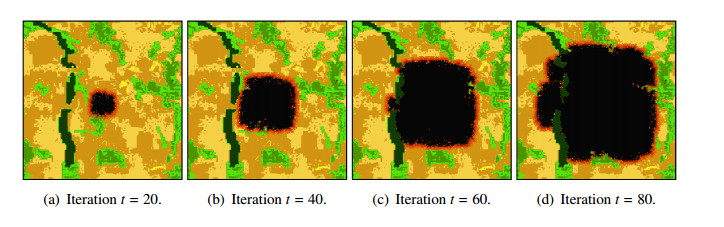
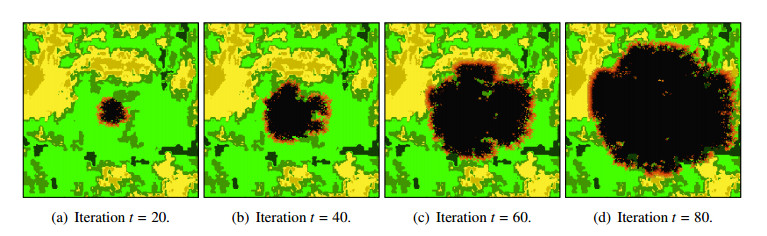
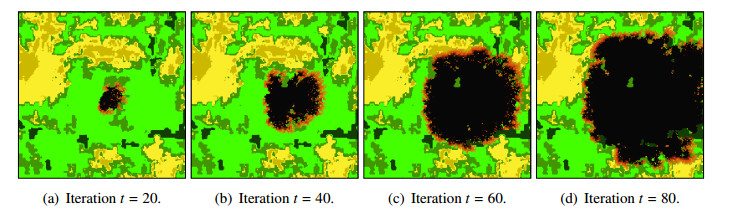
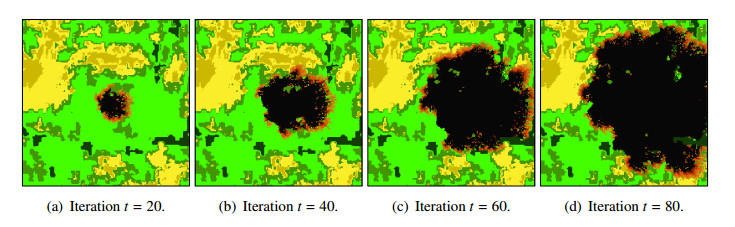
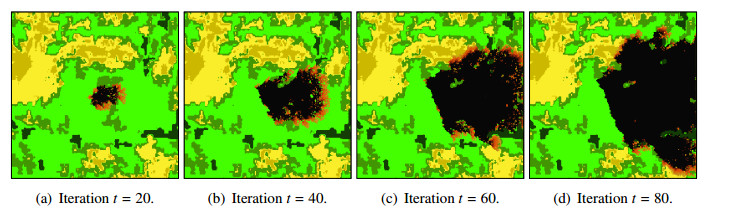
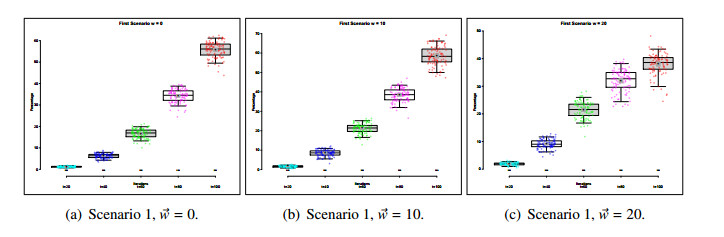
Wildfires pose a significant threat to both biodiversity and human communities, and understanding their behavior and the rate at which they burn through different vegetation types is crucial for effective management and conservation. In this research, we present a comprehensive analysis of wildfire behavior and vegetation burning rates in the unique ecosystem of Sete Cidades National Park. To achieve this, we adopt a qualiquantitative approach that combines both qualitative and quantitative methodologies, considering the multifaceted variables at play, including wind conditions, various vegetation types, and the dynamics of fire progression. We conducted an extensive dataset comprising $ 100 $ simulations for each of three distinct scenarios, ensuring robustness in our data for statistical analysis. By incorporating qualitative data obtained through field observations and expert opinions, we gain a deeper understanding of the contextual nuances specific to Sete Cidades National Park. This approach enriches the interpretation of our quantitative results, providing valuable context and real-world relevance. Our materials include a cellular automaton lattice with $ 200 \times 200 $ cells, representing the diverse landscape of the study area. We used MATLAB to visualize this landscape, generating distinct representations of the scenarios. Our findings reveal the distribution of different vegetation types across these scenarios, emphasizing the resilience of Rupestrian Cerrado, the diversity of Typical Cerrado, and the importance of Riparian Forest in preserving aquatic ecosystems. This research contributes to the broader understanding of wildfire management, considering the interdisciplinary aspects of environmental science, forestry, and meteorology. By integrating knowledge from diverse fields, we provide a holistic analysis that can inform effective conservation strategies and wildfire management practices.
Citation: Heitor Castro Brasiel, Danielli Araújo Lima. Clustered-map probabilistic cellular automata for fire propagation in the Brazilian Cerrado with heterogeneous vegetation and wind interference[J]. Urban Resilience and Sustainability, 2024, 2(1): 45-75. doi: 10.3934/urs.2024004
Wildfires pose a significant threat to both biodiversity and human communities, and understanding their behavior and the rate at which they burn through different vegetation types is crucial for effective management and conservation. In this research, we present a comprehensive analysis of wildfire behavior and vegetation burning rates in the unique ecosystem of Sete Cidades National Park. To achieve this, we adopt a qualiquantitative approach that combines both qualitative and quantitative methodologies, considering the multifaceted variables at play, including wind conditions, various vegetation types, and the dynamics of fire progression. We conducted an extensive dataset comprising $ 100 $ simulations for each of three distinct scenarios, ensuring robustness in our data for statistical analysis. By incorporating qualitative data obtained through field observations and expert opinions, we gain a deeper understanding of the contextual nuances specific to Sete Cidades National Park. This approach enriches the interpretation of our quantitative results, providing valuable context and real-world relevance. Our materials include a cellular automaton lattice with $ 200 \times 200 $ cells, representing the diverse landscape of the study area. We used MATLAB to visualize this landscape, generating distinct representations of the scenarios. Our findings reveal the distribution of different vegetation types across these scenarios, emphasizing the resilience of Rupestrian Cerrado, the diversity of Typical Cerrado, and the importance of Riparian Forest in preserving aquatic ecosystems. This research contributes to the broader understanding of wildfire management, considering the interdisciplinary aspects of environmental science, forestry, and meteorology. By integrating knowledge from diverse fields, we provide a holistic analysis that can inform effective conservation strategies and wildfire management practices.

| [1] | Ferreira MEA, Quinta ALMP, Lima DA, et al. (2022) Automatic evolutionary adjustment of cellular automata model for forest fire propagation, in International Conference on Cellular Automata for Research and Industry, Cham: Springer, 13402: 235–245. https://doi.org/10.1007/978-3-031-14926-9-21 |
| [2] | Alvarado ST, de Carvalho IS, Ferraz TM, et al. (2019) Effects of fire suppression policies on fire regimes in protected areas in the Cerrado. Biodiversidade Brasileira 9: 200. |
| [3] |
Karafyllidis I, Thanailakis A (1997) A model for predicting forest fire spreading using cellular automata. Ecol Model 99: 87–97. https://doi.org/10.1016/S0304-3800(96)01942-4 doi: 10.1016/S0304-3800(96)01942-4

|
| [4] |
Nhaga T, de Fátima Camarotti M, Correia MLD (2021) Subsidies for the implementation of Environmental Education in the National Park of Sete Cidades (PI, Brazil) through the perception of residents of a surrounding community. Braz J Environ Educ 16: 527–547. https://doi.org/10.34024/revbea.2021.v16.11008 doi: 10.34024/revbea.2021.v16.11008
|
| [5] |
Araújo KC, Andrade EB, Brasileiro AC, et al. (2020) Anurans of Sete Cidades National Park, Piauí state, northeastern Brazil. Biota Neotrop 20: e20201061. https://doi.org/10.1590/1676-0611-BN-2020-1061 doi: 10.1590/1676-0611-BN-2020-1061
|
| [6] | Oliveira MEA, Martins FR, Castro A, et al. (2007) Classes de cobertura vegetal do Parque Nacional de Sete Cidades (transição campo-floresta) utilizando imagens TM/Landsat, NE do Brasil, in XIII Simpósio Brasileiro de Sensoriamento Remoto, Florianópolis, Anais (Proceedings) 13: 1775–1783. |
| [7] |
Mendes MRA, Munhoz CBR, Silva Júnior MC, et al. (2012) Vegetation and soil relationship in moist grassland in the National Park of Sete Cidades, Piauí, Brazil. Rodriguesia 63: 971–984. https://doi.org/10.1590/S2175-78602012000400014 doi: 10.1590/S2175-78602012000400014
|
| [8] |
Matos MQ, Felfili JM (2010) Floristics, phytosociology and diversity of tree vegetation in gallery forests of Sete Cidades National Park (PNSC), Piauí, Brazil. Acta Bot Bras 24: 483–496. https://doi.org/10.1590/S0102-33062010000200019 doi: 10.1590/S0102-33062010000200019
|
| [9] |
Silva AAC, Vidal JMC, da Silva RA, et al. (2018) Forest fires in the Serra da Canastra National Park and the implementation of integrated fire management. ForScience 6: e00404. https://doi.org/10.29069/forscience.2018v6n2.e404 doi: 10.29069/forscience.2018v6n2.e404
|
| [10] |
Eloy L, Schmidt IB, Borges SL, et al. (2019) Seasonal fire management by traditional cattle ranchers prevents the spread of wildfire in the Brazilian Cerrado. Ambio 48: 890–899. https://doi.org/10.1007/s13280-018-1118-8 doi: 10.1007/s13280-018-1118-8
|
| [11] | Souza NLB, Lima DA (2019) Tabu search for the surveillance task optimization of a robot controlled by two-dimensional stochastic cellular automata ants model, in 2019 Latin American Robotics Symposium (LARS), 2019 Brazilian Symposium on Robotics (SBR) and 2019 Workshop on Robotics in Education (WRE), IEEE, Rio Grande, Brazil, 299–304. https://doi.org/10.1109/LARS-SBR-WRE48964.2019.00059 |
| [12] |
Lopes HJM, Lima DA (2022) Surveillance task optimized by Evolutionary shared Tabu Inverted Ant Cellular Automata Model for swarm robotics navigation control. Results Control Optim 8: 100141. https://doi.org/10.1016/j.rico.2022.100141 doi: 10.1016/j.rico.2022.100141
|
| [13] |
Lima DA, Oliveira GMB (2017) A cellular automata ant memory model of foraging in a swarm of robots. Appl Math Model 47: 551–572. https://doi.org/10.1016/j.apm.2017.03.021 doi: 10.1016/j.apm.2017.03.021
|
| [14] |
Monteiro LHA, Fanti VC, Tessaro AS (2020) On the spread of SARS-CoV-2 under quarantine: A study based on probabilistic cellular automaton. Ecol Complexity 44: 100879. https://doi.org/10.1016/j.ecocom.2020.100879 doi: 10.1016/j.ecocom.2020.100879
|
| [15] | Lima HA, Lima DA (2014) Autômatos celulares estocásticos bidimensionais aplicados a simulação de propagação de incêndios em florestas homogêneas, in Workshop on Computing Applied to the Management of the Envirionment and Natural Resources (WCAMA), SBC, 15–24. |
| [16] | Horibe K, Walker K, Risi S (2021) Regenerating soft robots through neural cellular automata, In: Genetic Programming, Cham: Springer, 12691: 36–50. https://doi.org/10.1007/978-3-030-72812-0-3 |
| [17] |
Bin S, Sun G, Chen CC (2019) Spread of infectious disease: modeling and analysis of different factors on the spread of infectious disease based on cellular automata. Int J Environ Res Public Health 16: 4683. https://doi.org/10.3390/ijerph16234683 doi: 10.3390/ijerph16234683
|
| [18] |
Monteiro LHA, Gandini DM, Schimit PHT (2020) The influence of immune individuals in disease spread evaluated by cellular automaton and genetic algorithm. Comput Methods Programs Biomed 196: 105707. https://doi.org/10.1016/j.cmpb.2020.105707 doi: 10.1016/j.cmpb.2020.105707
|
| [19] |
Lira ER, de Macêdo HB, Lima DA, et al. (2023) A reversible system based on hybrid toggle radius-4 cellular automata and its application as a block cipher. Nat Comput 2023: 1–17. https://doi.org/10.1007/s11047-023-09941-6 doi: 10.1007/s11047-023-09941-6
|
| [20] |
Dai J, Zhai C, Ai J, et al. (2020) Modeling the spread of epidemics based on cellular automata. Processes 9: 55. https://doi.org/10.3390/pr9010055 doi: 10.3390/pr9010055
|
| [21] |
Stănică GC, Anghelescu P (2023) Cryptographic algorithm based on hybrid one-dimensional cellular automata. Mathematics 11: 1481. https://doi.org/10.3390/math11061481 doi: 10.3390/math11061481
|
| [22] |
Lima DA, Cabral Jr E, Almeida ITR, et al. (2020) A fire elitist cellular automaton-based model to verify pedestrian flow simulated in real environments using Arduino. Proc Ser Braz Soc Comput Appl Math 2020: 7. https://doi.org/10.5540/03.2020.007.01.0338 doi: 10.5540/03.2020.007.01.0338
|
| [23] |
Chen M, Wu K, Zhang H, et al. (2023) A ship evacuation model considering the interaction between pedestrians based on cellular automata. Ocean Eng 281: 114644. https://doi.org/10.1016/j.oceaneng.2023.114644 doi: 10.1016/j.oceaneng.2023.114644
|
| [24] |
Yuan XT, Tang TQ, Chen L, et al. (2023) A fine grid cellular automaton model for pedestrian evacuation considering the effect of an obstacle. Simulation 99: 957–968. https://doi.org/10.1177/00375497231161146 doi: 10.1177/00375497231161146
|
| [25] |
Jellouli O, Bernoussi AS (2022) The impact of dynamic wind flow behavior on forest fire spread using cellular automata: Application to the watershed BOUKHALEF (Morocco). Ecol Model 468: 109938. https://doi.org/10.1016/j.ecolmodel.2022.109938 doi: 10.1016/j.ecolmodel.2022.109938
|
| [26] | Zan Y, Li D, Fu X (2022) Emulation of forest fire spread using ResNet and cellular automata, in 2022 7th International Conference on Computer and Communication Systems (ICCCS), IEEE, Wuhan, 109–114. https://doi.org/10.1109/ICCCS55155.2022.9845891 |
| [27] | Liu L, Hou L, Liu B, et al. (2022) Establishment and simulation of forest fire spreading model based on cellular automata, In: Advances in Intelligent Information Hiding and Multimedia Signal Processing, Singapore: Springer, 277: 129–140. https://doi.org/10.1007/978-981-19-1057-9-13 |
| [28] |
Sun L, Xu C, He Y, et al. (2021) Adaptive forest fire spread simulation algorithm based on cellular automata. Forests 12: 1431. https://doi.org/10.3390/f12111431 doi: 10.3390/f12111431
|
| [29] |
Gharakhanlou NM, Hooshangi N (2021) Dynamic simulation of fire propagation in forests and rangelands using a GIS-based cellular automata model. Int J Wildland Fire 30: 652–663. https://doi.org/10.1071/WF20098 doi: 10.1071/WF20098
|
| [30] | Zhao Y, Geng D (2021) Simulation of forest fire occurrence and spread based on cellular automata model. In 2021 2nd International Conference on Artificial Intelligence and Information Systems, 1–6. https://doi.org/10.1145/3469213.3471332 |
| [31] |
Zhang S, Liu J, Gao H, et al. (2022) Study on forest fire spread model of multi-dimensional cellular automata based on rothermel speed formula. CERNE 27: e-102932. https://doi.org/10.1590/01047760202127012932 doi: 10.1590/01047760202127012932
|
| [32] | Sun W, Wei W, Chen J, et al. (2021) Research on Amazon forest fire based on cellular automata simulation, in 2021 20th International Symposium on Distributed Computing and Applications for Business Engineering and Science (DCABES), IEEE, Nanning, 175–178. https://doi.org/10.1109/DCABES52998.2021.00051 |
| [33] | Byari M, Bernoussi AS, Ouardouz M, et al. (2021) Control of 3D cellular automata via actuator and space attributes: Application to fires forest, In: Cellular Automata, Cham: Springer, 12599: 123–133. https://doi.org/10.1007/978-3-030-69480-7-13 |
| [34] |
Darmawan S, Sari DK, Wikantika K, et al. (2020) Identification before-after forest fire and prediction of mangrove forest based on Markov-cellular automata in part of Sembilang national park, Banyuasin, South Sumatra, Indonesia. Remote Sens 12: 3700. https://doi.org/10.3390/rs12223700 doi: 10.3390/rs12223700
|
| [35] |
Mutthulakshmi K, Wee MRE, Wong YCK, et al. (2020) Simulating forest fire spread and fire-fighting using cellular automata. Chin J Phys 65: 642–650. https://doi.org/10.1016/j.cjph.2020.04.001 doi: 10.1016/j.cjph.2020.04.001
|
| [36] |
Bhakti HD, Ibrahim H, Fristella F, et al. (2020) Fire spread simulation using cellular automata in forest fire. IOP Conf Ser: Mater Sci Eng 821: 012037. https://doi.org/10.1088/1757-899X/821/1/012037 doi: 10.1088/1757-899X/821/1/012037
|
| [37] | Hesam S, Valizadeh Kamran K (2019) Intelligent management occurrence and spread of front fire in Gis by using cellular automata. case study: Golestan forest, in International Archives of the Photogrammetry, Remote Sensing and Spatial Information Sciences, Karaj, Iran, 42: 475–481. https://doi.org/10.5194/isprs-archives-XLII-4-W18-475-2019 |
| [38] |
Rui X, Hui S, Yu X, et al. (2018) Forest fire spread simulation algorithm based on cellular automata. Nat hazard 91: 309–319. https://doi.org/10.1007/s11069-017-3127-5 doi: 10.1007/s11069-017-3127-5
|
| [39] |
Giannino F, Russo L, Ascoli D, et al. (2017) Cellular automata simulation of forest fire behavior on Italian landscape: The case of Sardinia. AIP Conf Proc 1906: 100006. https://doi.org/10.1063/1.5012376 doi: 10.1063/1.5012376
|
| [40] | Putri ND, Gunawan PH (2017) The performance of OpenMP architecture for simulating fire spreading in forest area by cellular automata, in 2017 5th International Conference on Information and Communication Technology (ICoIC7), IEEE, Melaka, Malaysia, 1–5. https://doi.org/10.1109/ICoICT.2017.8074661 |
| [41] |
Zheng Z, Huang W, Li S, et al. (2017) Forest fire spread simulating model using cellular automaton with extreme learning machine. Ecol Model 348: 33–43. https://doi.org/10.1016/j.ecolmodel.2016.12.022 doi: 10.1016/j.ecolmodel.2016.12.022
|
| [42] | Xuehua W, Chang L, Jiaqi L, et al. (2016) A cellular automata model for forest fire spreading simulation, in IEEE Symposium Series on Computational Intelligence (SSCI), IEEE, Athens, 1–6. https://doi.org/10.1109/SSCI.2016.7849971 |
| [43] | Zhou G, Wu Q, Chen A (2017) Research of cellular automata model for forest fire spreading simulation. Chin J Sci Instrum 38: 288–294. |
| [44] | Schadschneider A, Eilhardt C, Nowak S, et al. (2011) Towards a calibration of the floor field cellular automaton, In: Peacock, R., Kuligowski, E., Averill, J. Author, Pedestrian and Evacuation Dynamics, Boston: Springer, 557–566. https://doi.org/10.1007/978-1-4419-9725-8-50 |
| [45] | Setzer AW, Sismanoglu, RA, dos Santos JGM (2019) Método do Cálculo do Risco de Fogo do Programa do INPE-Versão 11, junho/2019. CEP 12: 1–29. |
Figures(19) / Tables(5)
Heitor Castro Brasiel, Danielli Araújo Lima. Clustered-map probabilistic cellular automata for fire propagation in the Brazilian Cerrado with heterogeneous vegetation and wind interference[J]. Urban Resilience and Sustainability, 2024, 2(1): 45-75. doi: 10.3934/urs.2024004


 DownLoad: