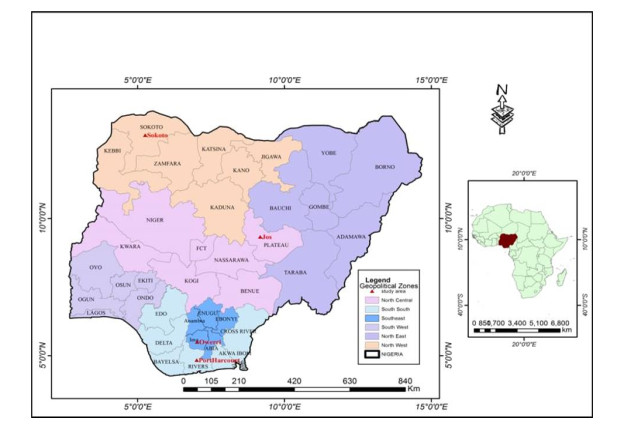
The study examined the relationship between informal economic activities, geopolitical regions/ecological zones and other sociodemographic variables in Jos, Owerri, Port Harcourt and Sokoto in Nigeria. Data were collected from 7605 informal business operators in four urban areas by using a simple data collection form. The analysis was carried out with descriptive statistics, chi-squared test statistics, correlation statistics and multinomial logistic regression models. The results showed significant differences in the different regions in terms of engagement in informal activities, including the age of respondents (chi = 784.38; p < 0.000), gender (chi = 1400; p < 0.000), education (chi = 1700; p < 0.000), marital status (chi = 663; p < 0.000) and economic activity (chi = 1400; p < 0.000). Finally, the logistic models indicated that the region of residence and sociodemographic characteristics significantly predicted the likelihood of engaging in different informal activities. The study recommends taking the demographic, regional and ecological profiles of the informal sector operators into consideration in the formulation of new government policies and programs for the growth of the informal sector and the well-being of people engaged in it. Further, it recommends the sensitization of the various informal sector subgroups by governmental agencies, non-governmental organizations and international actors according to the types of informal activities in which each has a comparative advantage. Apart from the direct benefits of the investigation to the people in the four Nigerian cities, the study is expected to be of value to other urban areas in the country and their counterparts in developing countries.
Citation: Emmanuella Chinenye Onyenechere, Abiodun Ayooluwa Areola, John Olugbenga Abe, Iwundu Anthony Onyekwere, Cyprian Echefu Ezedike, Chidozie Emmanuel Duruji, Florence Bolajoko Adeniyi, Winifred Nwabuaku Kanu, Franklin Chimaobi Okoro. Sociodemographic factors associated with informal sector activities in selected urban areas of Nigeria[J]. Urban Resilience and Sustainability, 2023, 1(1): 48-65. doi: 10.3934/urs.2023004
The study examined the relationship between informal economic activities, geopolitical regions/ecological zones and other sociodemographic variables in Jos, Owerri, Port Harcourt and Sokoto in Nigeria. Data were collected from 7605 informal business operators in four urban areas by using a simple data collection form. The analysis was carried out with descriptive statistics, chi-squared test statistics, correlation statistics and multinomial logistic regression models. The results showed significant differences in the different regions in terms of engagement in informal activities, including the age of respondents (chi = 784.38; p < 0.000), gender (chi = 1400; p < 0.000), education (chi = 1700; p < 0.000), marital status (chi = 663; p < 0.000) and economic activity (chi = 1400; p < 0.000). Finally, the logistic models indicated that the region of residence and sociodemographic characteristics significantly predicted the likelihood of engaging in different informal activities. The study recommends taking the demographic, regional and ecological profiles of the informal sector operators into consideration in the formulation of new government policies and programs for the growth of the informal sector and the well-being of people engaged in it. Further, it recommends the sensitization of the various informal sector subgroups by governmental agencies, non-governmental organizations and international actors according to the types of informal activities in which each has a comparative advantage. Apart from the direct benefits of the investigation to the people in the four Nigerian cities, the study is expected to be of value to other urban areas in the country and their counterparts in developing countries.

| [1] | World Bank, Understanding poverty. The World Bank, 2018. Available from: http://www.worldbank.org/en/topic/poverty/overview |
| [2] | Chidoko C, Makuyana G (2012) The contribution of the informal sector to poverty alleviation in Zimbabwe. Dev Country Stud 2: 41-44. |
| [3] | Chen M, The Informal Economy: Definitions, Theories and Policies. Women in Informal Employment: Globalizing and Organizing (WIEGO), 2012. Available from: http://wiego.org/sites/wiego.org/files/publications/files/Chen_WIEgo_WP1.pdf |
| [4] |
Darbi W, Knott P (2016) Strategising practices in an informal economy setting: A case of strategic networking. Eur Manage J 34: 400-413. https://doi.org/10.1016/j.emj.2015.12.009 doi: 10.1016/j.emj.2015.12.009

|
| [5] |
Peprah V, Buor D, Forkuor D (2019) Characteristics of informal sector activities and challenges faced by women in Kumasi Metropolis, Ghana. Cogent Soc Sci 5: 1656383. https://doi.org/10.1080/23311886.2019.1656383 doi: 10.1080/23311886.2019.1656383
|
| [6] | Bank of Industry, Economic Development through the Nigerian Informal Sector: A BOI perspective. Bank of Industry, Nigeria, 2018. Available from: https://boi.ng/wp-content/uploads/2018/05/BOI-Working-Paper-Series-No2_Economic-Development-through-the-Nigerian-Informal-Sector-A-BOI-perspective.pdf |
| [7] | National Bureau of Statistics, Annual Report 2018. National Bureau of Statistics, 2018. Available from: https://nigerianstat.gov.ng/elibrary |
| [8] | Angel-Urdinola D, Semlali A, Brodmann S, Non-public provision of Active Labor Market Programs in Arab-Mediterranean Countries: an inventory of youth programmes. The World Bank, 2010. Available from: https://www.cmimarseille.org/sites/default/files/newsite/library/files/en//SELM5_SocialProtection_WB-2010.pdf |
| [9] | Angel-Urdinola D, Tanabe K, Micro-Determinants of Informal Employment in the Middle East and North Africa Region. The World Bank, 2012. Available from: https://openknowledge.worldbank.org/handle/10986/26828 |
| [10] |
McCaig B, Pavcnik N (2015) Informal employment in a growing and globalizing low-income country. Am Econ Rev 105: 545-550. https://doi.org/10.1257/aer.p20151051 doi: 10.1257/aer.p20151051
|
| [11] |
Williams C, Shahid M, Martinez A (2016) Determinants of the level of informality of informal micro-enterprises: some evidence from the city of Lahore, Pakistan. World Dev 84: 312-325. https://doi.org/10.1016/j.worlddev.2015.09.003 doi: 10.1016/j.worlddev.2015.09.003
|
| [12] |
Williams C, Windebank J (2002) The uneven geographies of informal economic activities: a case study of two British cities. Work Employ Soc 16: 231-250. https://doi.org/10.1177/095001702400426820 doi: 10.1177/095001702400426820
|
| [13] |
Williams C (2011) Entrepreneurship, the informal economy and rural communities. J Enterp Commun 5: 145-157. https://doi.org/10.1108/17506201111131578 doi: 10.1108/17506201111131578
|
| [14] |
Williams C (2014) Out of the shadows: a classification of economies by the size and character of their informal sector. Work Employ Soc 8: 735-753. https://doi.org/10.1177/0950017013501951 doi: 10.1177/0950017013501951
|
| [15] |
Jensen L, Tickamyer A, Slack T (2019) Rural-urban variation in informal work activities in the United States. J Rural Stud 68: 276-284. https://doi.org/10.1016/j.jrurstud.2019.02.009 doi: 10.1016/j.jrurstud.2019.02.009
|
| [16] | Hoffmann L, Melly P (2018) Incentives and constraints of informal trade between Nigeria and its neighbours. In: West African Papers, Paris: OECD Publishing. |
| [17] | Musyoki A, The emerging policy for Green Economy and Social Development in Limpopo, South Africa. United Nations Research Institute for Social Development (UNRISD), 2012. Available from: https://www.econstor.eu/bitstream/10419/148789/1/862573408.pdf |
| [18] | Peacock K A (2011) Symbiosis in ecology and evolution. In: K. deLaplante, B. Brown, K. A. Peacock, Handb Philos Sci: Philos Ecol, North Holland: Elsevier, 219-250. https://doi.org/10.1016/B978-0-444-51673-2.50009-1 |
| [19] | Hawley A (1981) Human ecology: persistence and change. Am Behav Sci 24: 423-444. |
| [20] | Bubolz M, Sontag M (1993) Human ecology theory. In: P. G. Boss, W. J. Doherty, R. LaRossa, W. R. Schumm, and S. K.Steinmetz, Sourcebook of family theories and methods: A contextual approach, New York: Plenum Press, 419-450. |
| [21] | Hart K (1973) Informal income opportunities and urban employment in Ghana. J Mod Afr Stud 11: 61-89. |
| [22] | International Labour Organisation (ILO) (2002) Women and men in the informal economy: a statistical picture, Geneva: International Labour Office. |
| [23] | Fapohunda T (2012) Women and the informal sector in Nigeria: implications for development. Br J Art Soc Sci 4: 35-45. |
| [24] | Mabogunje A, Filani M (1977) Absorption of migrants into Kano City, Nigeria. In: World Employment Programme Research Working Paper. Geneva: International Labour Office. |
| [25] | Onokerhoraye A (1977) Occupational specialization by ethnic groups in the informal sector of the urban economies of traditional Nigerian cities: The case of Benin. Afr Stud Rev 20: 53-69. |
| [26] | Abumere S (1978) Understanding economic development in Nigeria: The relevance and irrelevance of the dualistic theory. Niger J Econ Soc Stud 20: 379-406. |
| [27] | Onyebueke V, Geyer M (2011) The informal sector in urban Nigeria: reflections from almost four decades of research. Town Reg Plann 59: 65-76. |
| [28] |
Arimah B (2001) Nature and determinants of the linkages between informal and formal sector enterprises in Nigeria. Afr Dev Rev 13: 114-144. https://doi.org/10.1111/1467-8268.00033 doi: 10.1111/1467-8268.00033
|
| [29] |
Jelili M, Adedibu A (2006) Land use classification and informal sector question in Ogbomoso, Nigeria. J Hum Ecol, 20: 283-287. https://doi.org/10.1080/09709274.2006.11905940 doi: 10.1080/09709274.2006.11905940
|
| [30] | Akande O, Akerele W (2008) Employment generation in the informal sector of the Nigerian economy, Ibadan: Nigerian Institute of Social and Economic Research. |
| [31] | Duru M (2012) Nigeria's informal sector: Opportunities for self employment and income generation. Econ Finance Rev 1: 35-41. |
| [32] |
Onyenechere E (2009) The constraints of rural women in informal economic activities in Imo State, Nigeria. Afr Dev 34: 83-101. https://doi.org/10.4314/ad.v34i1.57359 doi: 10.4314/ad.v34i1.57359
|
| [33] | Weng X, Recognising informality in the China -Africa natural resource trade. International Institute for Environment and Development (IIED), 2015. Available from: http://pubs.iied.org/pdfs/17286IIED.pdf |
| [34] | Ndumbaro F (2014) Understanding spatial distribution of informal sector activities for income poverty alleviation: the case of Iringa Municipality, Tanzania. Int J Bus, Humanit Technol 4:98-105. |
| [35] | Research and Analysis Working Group (2002). Poverty and Human Development Report 2002, Tanzania: Mkukina Nyota Publishers. |
| [36] | Igudia E, The Nigerian informal economy: a regional analysis, (United Kingdom), xDoctoral Thesis of Nottingham Trent Universityx on, 2014. |
| [37] | Olajoke A, Adeboyejo T, Kehinde O (2013) Residents' perception on environmental impacts of urban informal enterprises in Ibadan, Nigeria. Res Hum Soc Sci 3: 21-27. |
| [38] |
Loayza N (1996) The economics of the informal sector: A simple model and some empirical evidence from Latin America. Carnegie-Rochester Conf Ser Public Policy 45: 129-162. https://doi.org/10.1016/S0167-2231(96)00021-8 doi: 10.1016/S0167-2231(96)00021-8
|
| [39] | Becker K (2004) The informal economy, Sweden: Sida. |
| [40] | Castells M, Portes A (1989) World underneath: The origins, dynamics, and effects of the informal economy. In: A. Portes, M. Castells and L. Benton, The Informal Economy: Studies in Advanced and Less Advanced Developed Countries, Baltimore: Johns Hopkins Press. |
| [41] |
Marcelli A, Pastor, Joassert M (1999) Estimating the effect of informal economic activity: Evidence from Los Angeles Count. J Econ Issues 332: 579-607. https://doi.org/10.1080/00213624.1999.11506187 doi: 10.1080/00213624.1999.11506187
|
| [42] | International Labour Organisation (ILO) (1972) Employment, incomes and equality: A strategy for increasing productive employment in Kenya, Geneva: International Labour Office. |
| [43] | Losby J, Edgcomb E, Else F, et al. (2002) Informal economy literature review. ISED Consult Res. |
| [44] |
Isachsen A, Strom S (1985) The size and growth of the hidden economy in Norway. Rev Income Wealth 31: 21-38. https://doi.org/10.1111/j.1475-4991.1985.tb00496.x doi: 10.1111/j.1475-4991.1985.tb00496.x
|
| [45] | Franicevic V (1999) Political economy of the unofficial economy: The state and regulation. In: E. Feige and K. Ott, Underground economies in Transition: Unrecorded Activity, Tax Evasion, Corruption and Organized Crime, Aldershot: Ashgate. |
| [46] | Schneider F, Braithwaite V, Reinhart M, Individual behaviour in Australia's shadow economy: facts, empirical findings and some mysteries. Australian National University, 2001. Available from: https://openresearch-repository.anu.edu.au/bitstream/1885/41636/2/WP19.pdf |
| [47] | Giese S, Hoffman G, Tax evasion and risky investments in an intertemporal context: An experimental study. Humboldt University of Berlin, 2000. Available from: https://www.econstor.eu/bitstream/10419/62187/1/723751617.pdf |
| [48] |
Muhanga M (2017) Informal sector in urban areas in Tanzania: Some sociodemographic, economic and legal aspects. Int J Acc Econ Stud 5: 163-168. https://doi.org/10.14419/ijaes.v5i2.8495 doi: 10.14419/ijaes.v5i2.8495
|
| [49] |
Portes A, Sassen-Koob S (1987) Making it underground: Comparative materials on the informal sector in Western market economies. Am J Soc 93: 30-61. https://doi.org/10.1086/228705 doi: 10.1086/228705
|
| [50] |
Chukuezi C (2010) Urban informal sector and unemployment in third-world cities: The situation in Nigeria. Asian Soc Sci 6: 131-137. https://doi.org/10.5539/ASS.V6N8P131 doi: 10.5539/ASS.V6N8P131
|
| [51] |
John-Nsa C (2021) Understanding the factors influencing the spatial dynamics of informal settlements: The case of Enugu City, Nigeria. Town Reg Plann 79: 29-43. https://doi.org/10.18820/2415-0495/trp79i1.5 doi: 10.18820/2415-0495/trp79i1.5
|
| [52] |
Lau C, Bobashev G (2014) Respondent driven sampling: A new method to sample businesses in Africa. J Afr Econ 24: 128-147. https://doi.org/10.1093/jae/eju023 doi: 10.1093/jae/eju023
|
| [53] | Kozinetz C (1992) From research question to analysis: The importance of data collection form design. Fam Pract Res J 12: 17-25. |
| [54] | Meade M, Richardson W (1997) Selecting appropriate studies for a systematic review. Ann Int Med 127: 531-537. |
| [55] | Ghana Statistical Service, Population and housing census 2010. Ghana Statistical Service, 2013. Available from: https://www2.statsghana.gov.gh/nada/index.php/catalog/51 |
| [56] | Onyenechere E (2011) Spatial distribution of women informal economic activities in the rural areas of Imo State, Nigeria. J Geogr and Reg Plann 4: 20-35. |

Figures(2) / Tables(6)
Emmanuella Chinenye Onyenechere, Abiodun Ayooluwa Areola, John Olugbenga Abe, Iwundu Anthony Onyekwere, Cyprian Echefu Ezedike, Chidozie Emmanuel Duruji, Florence Bolajoko Adeniyi, Winifred Nwabuaku Kanu, Franklin Chimaobi Okoro. Sociodemographic factors associated with informal sector activities in selected urban areas of Nigeria[J]. Urban Resilience and Sustainability, 2023, 1(1): 48-65. doi: 10.3934/urs.2023004


 DownLoad: