COVID-19 pandemic causes drastic changes in workplaces that are likely to increase quite quitting among employees. Although quiet quitting is not a new phenomenon, there is no instrument to measure it.
To develop and validate an instrument assessing quiet quitting among employees.
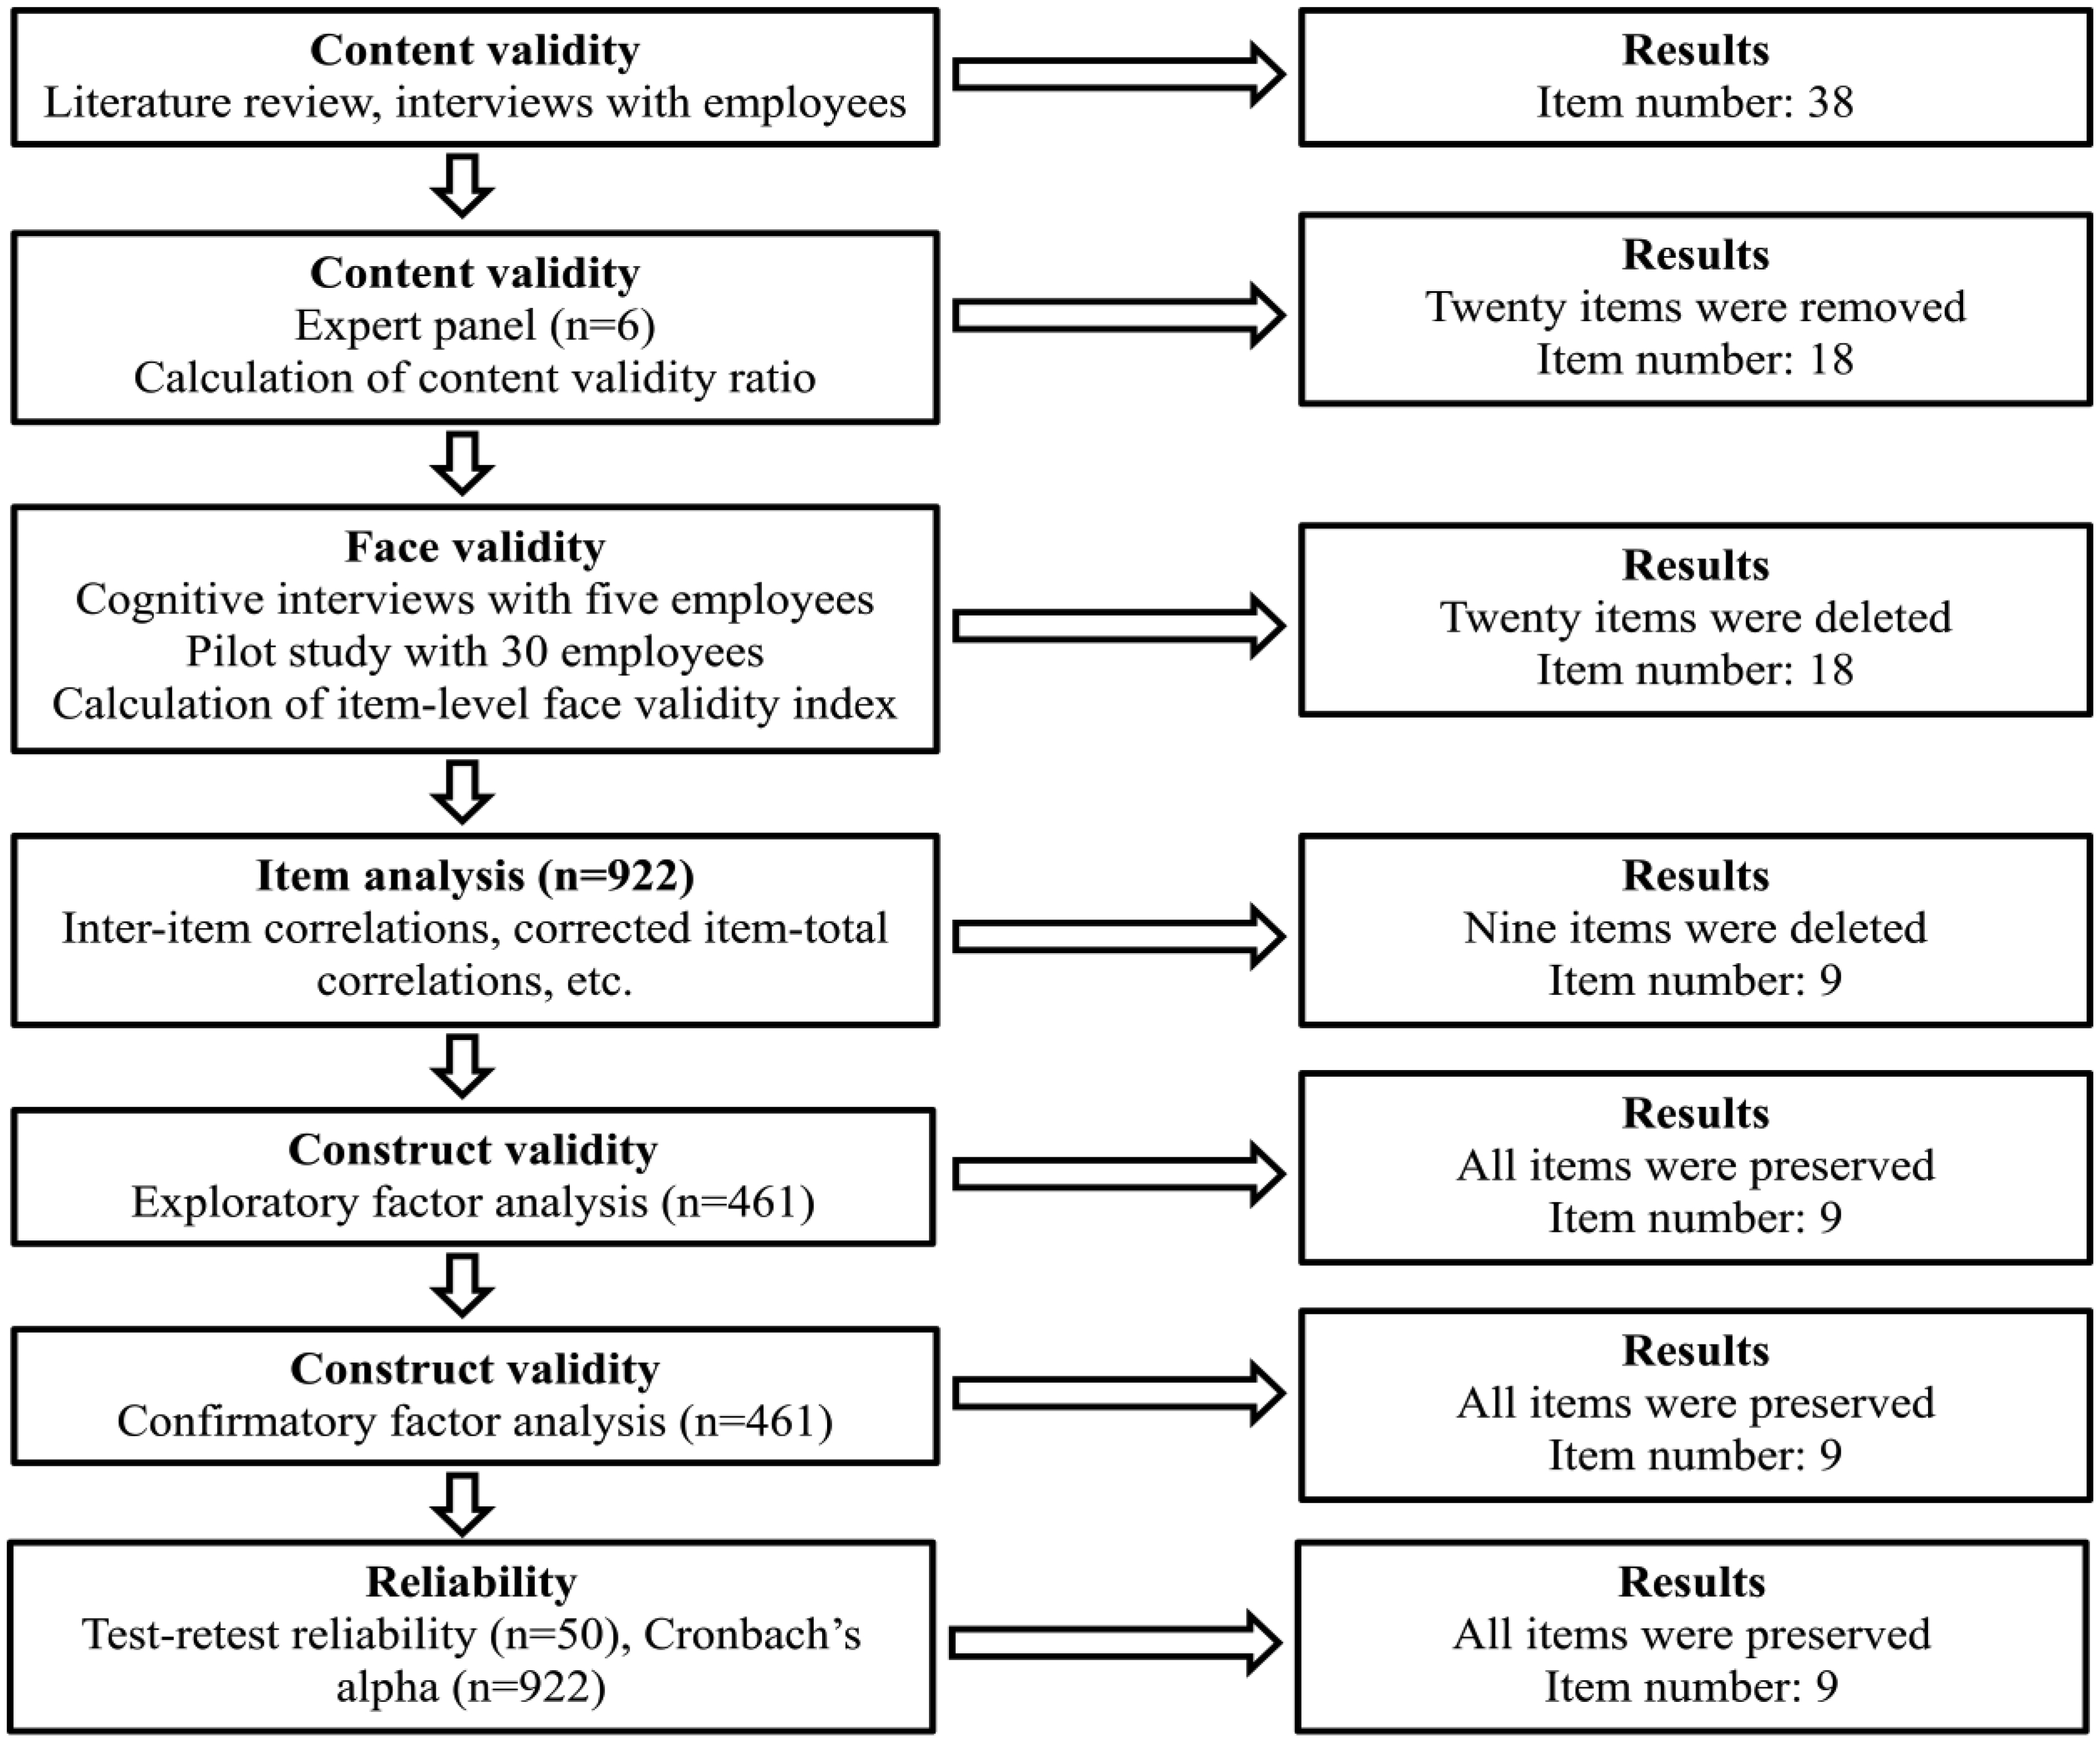
We identified and generated items through an extensive literature review and interviews with employees. We carried out the content validity by content experts and we calculated the content validity ratio. We checked face validity by conducting cognitive interviews with employees and calculating the item-level face validity index. We conducted exploratory and confirmatory factor analysis to investigate the quiet quitting scale (QQS) factorial structure. We checked the concurrent validity of the QQS using four other scales, i.e., Copenhagen burnout inventory (CBI), single item burnout (SIB) measure, job satisfaction survey (JSS) and a single item to measure turnover intention. We estimated the reliability of the QQS measuring Cronbach's alpha, McDonald's omega, Cohen's kappa and intraclass correlation coefficient.
After expert panel review and item analysis, nine items with acceptable corrected item-total correlations, inter-item correlations, floor and ceiling effects, skewness and kurtosis were retained. Exploratory factor analysis extracted three factors, namely detachment, lack of initiative and lack of motivation, with a total of nine items. Confirmatory factor analysis confirmed this factorial structure for QQS. We found statistically significant correlations between QQS and CBI, SIB, JSS and turnover intention confirming that the concurrent validity of the QQS was great. Cronbach's alpha and McDonald's omega of the QQS were 0.803 and 0.806 respectively.
QQS, a three-factor nine-item scale, has robust psychometric properties. QQS is an easy-to-administer, brief, reliable and valid tool to measure employees' quiet quitting. We recommend the use of the QQS in different societies and cultures to assess the validity of the instrument.
Citation: Petros Galanis, Aglaia Katsiroumpa, Irene Vraka, Olga Siskou, Olympia Konstantakopoulou, Ioannis Moisoglou, Parisis Gallos, Daphne Kaitelidou. The quiet quitting scale: Development and initial validation[J]. AIMS Public Health, 2023, 10(4): 828-848. doi: 10.3934/publichealth.2023055
COVID-19 pandemic causes drastic changes in workplaces that are likely to increase quite quitting among employees. Although quiet quitting is not a new phenomenon, there is no instrument to measure it.
To develop and validate an instrument assessing quiet quitting among employees.
We identified and generated items through an extensive literature review and interviews with employees. We carried out the content validity by content experts and we calculated the content validity ratio. We checked face validity by conducting cognitive interviews with employees and calculating the item-level face validity index. We conducted exploratory and confirmatory factor analysis to investigate the quiet quitting scale (QQS) factorial structure. We checked the concurrent validity of the QQS using four other scales, i.e., Copenhagen burnout inventory (CBI), single item burnout (SIB) measure, job satisfaction survey (JSS) and a single item to measure turnover intention. We estimated the reliability of the QQS measuring Cronbach's alpha, McDonald's omega, Cohen's kappa and intraclass correlation coefficient.
After expert panel review and item analysis, nine items with acceptable corrected item-total correlations, inter-item correlations, floor and ceiling effects, skewness and kurtosis were retained. Exploratory factor analysis extracted three factors, namely detachment, lack of initiative and lack of motivation, with a total of nine items. Confirmatory factor analysis confirmed this factorial structure for QQS. We found statistically significant correlations between QQS and CBI, SIB, JSS and turnover intention confirming that the concurrent validity of the QQS was great. Cronbach's alpha and McDonald's omega of the QQS were 0.803 and 0.806 respectively.
QQS, a three-factor nine-item scale, has robust psychometric properties. QQS is an easy-to-administer, brief, reliable and valid tool to measure employees' quiet quitting. We recommend the use of the QQS in different societies and cultures to assess the validity of the instrument.

| [1] |
Scheyett A (2022) Quiet quitting. Soc Work 68: 5-7. https://doi.org/10.1093/sw/swac051 
|
| [2] | Formica S, Sfodera F (2022) The great resignation and quiet quitting paradigm shifts: An overview of current situation and future research directions. J Hosp Mark 31: 899-907. https://doi.org/10.1080/19368623.2022.2136601 |
| [3] |
Hamouche S, Chabani Z (2021) COVID-19 and the new forms of employment relationship: implications and insights for human resource development. Ind Commer Train 53: 366-379. https://doi.org/10.1108/ICT-11-2020-0112
|
| [4] |
Liu Lastres B, Wen H, Huang WJ (2023) A reflection on the great resignation in the hospitality and tourism industry. Int J Contemp Hosp M 35: 235-249. https://doi.org/10.1108/IJCHM-05-2022-0551
|
| [5] |
Zuzelo PR (2023) Discouraging quiet quitting: Potential strategies for nurses. Holist Nurs Prac 37: 174-175. https://doi.org/10.1097/HNP.0000000000000583
|
| [6] |
Serenko A (2023) The Great Resignation: The great knowledge exodus or the onset of the great knowledge revolution?. J Knowl Manag 27: 1042-1055. https://doi.org/10.1108/JKM-12-2021-0920
|
| [7] |
Forrester N (2023) Fed up and burnt out: “Quiet quitting” hits academia. Nature 615: 751-753. https://doi.org/10.1038/d41586-023-00633-w
|
| [8] |
Lu M, Al Mamun A, Chen X, et al. (2023) Quiet quitting during COVID-19: The role of psychological empowerment. Humanit Soc Sci Commun 10: 485. https://doi.org/10.1057/s41599-023-02012-2
|
| [9] |
Boy Y, Sürmeli M (2023) Quiet quitting: A significant risk for global healthcare. J Glob Health 13: 03014. https://doi.org/10.7189/jogh.13.03014
|
| [10] | Galanis P (2023) Quiet quitting: A significant threat for healthcare industry or an inevitable reaction of the healthcare workers?. Int J Caring Sci 16: 512-513. |
| [11] | Constantz J Quiet quitters' make up half of the US workforce, Gallup finds (2022). Available from: https://www.bloomberg.com/news/articles/2022-09-06/-quiet-quitters-make-up-half-of-the-us-workforce-gallup-finds. |
| [12] |
Le LH, Hancer M, Chaulagain S, Pham P (2023) Reducing hotel employee turnover intention by promoting pride in job and meaning of work: A cross-cultural perspective. Int J Hosp Manag 109: 103409. https://doi.org/10.1016/j.ijhm.2022.103409
|
| [13] | ResumeBuilder1 in 4 of workers are ‘quiet quitting’ saying no Husle culture (2022). Available from: https://www.resumebuilder.com/1-in-4-of-workers-quiet-quitting-saying-no-to-hustle-culture/. |
| [14] |
Alkhamees AA, Aljohani MS, Kalani S, et al. (2023) Physician's burnout during the COVID-19 pandemic: A systematic review and meta-analysis. Int J Environ Res Public Health 20: 4598. https://doi.org/10.3390/ijerph20054598
|
| [15] |
Galanis P, Vraka I, Fragkou D, et al. (2021) Nurses' burnout and associated risk factors during the COVID-19 pandemic: A systematic review and meta-analysis. J Adv Nurs 77: 3286-3302. https://doi.org/10.1111/jan.14839
|
| [16] |
Westphal A, Kalinowski E, Hoferichter CJ, Vock M (2022) K-12 teachers' stress and burnout during the COVID-19 pandemic: A systematic review. Front Psychol 13: 920326. https://doi.org/10.3389/fpsyg.2022.920326
|
| [17] |
Adanaqué-Bravo I, Escobar-Segovia K, Gómez-Salgado J, et al. (2022) Relationship between psychological distress, burnout and work engagement in workers during the COVID-19 pandemic: A systematic review. Int J Public Health 67: 1605605. https://doi.org/10.3389/ijph.2022.1605605
|
| [18] |
Edú-Valsania S, Laguía A, Moriano JA (2022) Burnout: A review of theory and measurement. Int J Environ Res Public Health 19: 1780. https://doi.org/10.3390/ijerph19031780
|
| [19] | Kulikowski K (2017) Do we all agree on how to measure work engagement? Factorial validity of Utrecht Work Engagement Scale as a standard measurement tool-A literature review. Int J Occup Med Environ Health 30: 161-175. https://doi.org/10.13075/ijomeh.1896.00947 |
| [20] |
Shen X, Jiang H, Xu H, et al. (2020) The global prevalence of turnover intention among general practitioners: a systematic review and meta-analysis. BMC Fam Pract 21: 246. https://doi.org/10.1186/s12875-020-01309-4
|
| [21] |
van Saane N, Sluiter JK, Verbeek JH, et al. (2003) Reliability and validity of instruments measuring job satisfaction--a systematic review. Occup Med (Lond) 53: 191-200. https://doi.org/10.1093/occmed/kqg038
|
| [22] |
Maslach C, Jackson SE (1981) The measurement of experienced burnout. J Organiz Behav 2: 99-113. https://doi.org/10.1002/job.4030020205
|
| [23] |
Feldt T, Rantanen J, Hyvönen K, et al. (2014) The 9-item Bergen Burnout Inventory: Factorial validity across organizations and measurements of longitudinal data. Ind Health 52: 102-112. https://doi.org/10.2486/indhealth.2013-0059
|
| [24] |
Schaufeli WB, Bakker AB, Salanova M (2006) The measurement of work engagement with a short questionnaire: A cross-national study. Educ and Psychol Meas 66: 701-716. https://doi.org/10.1177/0013164405282471
|
| [25] |
McCoach D, Gable R, Madura J (2013) Review of the steps for designing an instrument. Instrument development in the affective domain . New York: Springer 277-284.
|
| [26] |
Shoman Y, Marca SC, Bianchi R, et al. (2021) Psychometric properties of burnout measures: a systematic review. Epidemiol Psychiatr Sci 30: e8. https://doi.org/10.1017/S2045796020001134
|
| [27] |
Williamson K, Lank PM, Cheema N, et al. (2018) Comparing the Maslach Burnout Inventory to Other Well-Being Instruments in Emergency Medicine Residents. J Grad Med Educ 10: 532-536. https://doi.org/10.4300/JGME-D-18-00155.1
|
| [28] |
Seiler N, Davoodi K, Keem M, et al. (2023) Assessment tools for complex post traumatic stress disorder: A systematic review. Int J Psychiat Clin 27: 292-300. https://doi.org/10.1080/13651501.2023.2197965
|
| [29] |
Kragh AR, Folke F, Andelius L, et al. (2019) Evaluation of tools to assess psychological distress: how to measure psychological stress reactions in citizen responders-a systematic review. BMC Emerg Med 19: 64. https://doi.org/10.1186/s12873-019-0278-6
|
| [30] |
Wangler S, Streffing J, Simon A, et al. (2022) Measuring job satisfaction of midwives: A scoping review. PLoS One 17: e0275327. https://doi.org/10.1371/journal.pone.0275327
|
| [31] | Kristensen TS, Borritz M, Villadsen E, et al. (2005) The Copenhagen Burnout Inventory: A new tool for the assessment of burnout. Work & Stress 19: 192-207. https://doi.org/10.1080/02678370500297720 |
| [32] |
Spector P (1985) Measurement of human service staff satisfaction: Sevelopment of the Job Satisfaction Survey. Am J Community Psychol 13: 693-713. https://doi.org/10.1007/BF00929796
|
| [33] |
Hansen V, Pit S (2016) The Single Item Burnout Measure is a psychometrically sound screening tool for occupational burnout. Health Scope 5: e32164. https://doi.org/10.17795/jhealthscope-32164
|
| [34] |
Macdonald S, Maclntyre P (1997) The Generic Job Satisfaction Scale: Scale development and its correlates. Empl Assistance Q 13: 1-16. https://doi.org/10.1300/J022v13n02_01
|
| [35] |
Ayre C, Scally AJ (2014) Critical Values for Lawshe's Content Validity Ratio: Revisiting the original methods of calculation. Meas Eval Couns Dev 47: 79-86. https://doi.org/10.1177/0748175613513808
|
| [36] |
Meadows K (2021) Cognitive interviewing methodologies. Clin Nurs Res 30: 375-379. https://doi.org/10.1177/10547738211014099
|
| [37] |
Yusoff MSB (2019) ABC of response process validation and face validity index calculation. Educ Med J 11: 55-61. https://doi.org/10.21315/eimj2019.11.3.6
|
| [38] | Costello AB, Osborne J (2005) Best practices in exploratory factor analysis: Four recommendations for getting the most from your analysis. Pract Assessment, Res Evaluation 10: 1-9. https://doi.org/10.7275/JYJ1-4868 |
| [39] |
DeVon HA, Block ME, Moyle-Wright P, et al. (2007) A psychometric toolbox for testing validity and reliability. J Nurs Scholarsh 39: 155-164. https://doi.org/10.1111/j.1547-5069.2007.00161.x
|
| [40] | De Vaus D (2004) Surveys in social research. Constructing questionnaires . London: Routledge 94. |
| [41] |
Yusoff MSB, Arifin WN, Hadie SNH (2021) ABC of questionnaire development and validation for survey research. Educ Med J 13: 97-108. https://doi.org/10.21315/eimj2021.13.1.10
|
| [42] |
McHorney CA, Tarlov AR (1995) Individual-patient monitoring in clinical practice: are available health status surveys adequate?. Qual Life Res 4: 293-307. https://doi.org/10.1007/BF01593882
|
| [43] |
Terwee CB, Bot SDM, De Boer MR, et al. (2007) Quality criteria were proposed for measurement properties of health status questionnaires. J Clin Epidemiol 60: 34-42. https://doi.org/10.1016/j.jclinepi.2006.03.012
|
| [44] |
De Winter JCF, Dodou D, Wieringa PA (2009) Exploratory factor analysis with small sample sizes. Multivar Behav Res 44: 147-181. https://doi.org/10.1080/00273170902794206
|
| [45] | Kline R (2016) Principles and practice of structural equation modelling. Specification and identification of confirmatory factor analysis models . New York: Guilford Press 188. |
| [46] | Hair J, Black W, Babin B, et al. (2010) Multivariate data analysis. Exploratory factor analysis . London: Cengage Learning EMEA 145. |
| [47] |
Bland JM, Altman DG (1997) Statistics notes: Cronbach's alpha. BMJ 314: 572-572. https://doi.org/10.1136/bmj.314.7080.572
|
| [48] | Brown T (2015) Confirmatory Factor Analysis for Applied Research. Specification and interpretation of CFA models . New York: The Guilford Press 215. |
| [49] |
Hu L, Bentler PM (1998) Fit indices in covariance structure modeling: Sensitivity to underparameterized model misspecification. Psychol Methods 3: 424-453. https://doi.org/10.1037/1082-989X.3.4.424
|
| [50] |
Baumgartner H, Homburg C (1996) Applications of structural equation modeling in marketing and consumer research: A review. Int J Res Mark 13: 139-161. https://doi.org/10.1016/0167-8116(95)00038-0
|
| [51] |
Spector P, Dwyer DJ, Jex SM (1988) Relation of job stressors to affective, health, and performance outcomes: A comparison of multiple data sources. J Appl Psychol 73: 11-19. https://doi.org/10.1037/0021-9010.73.1.11
|
| [52] |
Tsounis A, Sarafis P (2018) Validity and reliability of the Greek translation of the Job Satisfaction Survey (JSS). BMC Psychol 6: 27. https://doi.org/10.1186/s40359-018-0241-4
|
| [53] |
Papaefstathiou E, Tsounis A, Malliarou M, et al. (2019) Translation and validation of the Copenhagen Burnout Inventory amongst Greek doctors. Health Psychol Res 7: 7678. https://doi.org/10.4081/hpr.2019.7678
|
| [54] | Galanis P, Katsiroumpa A, Vraka I, et al. The single item burnout measure is a reliable and valid tool to measure occupational burnout (2023). Available from: https://www.medrxiv.org/content/10.1101/2023.03.06.23286842v1 |
| [55] | World Medical Association.World Medical Association Declaration of Helsinki: Ethical principles for medical research involving human subjects. JAMA (2013) 310: 2191-2194. https://doi.org/10.1001/jama.2013.281053 |
| [56] |
Coyle-Shapiro JA-M, Pereira Costa S, Doden W, et al. (2019) Psychological contracts: Past, present, and future. Annu Rev Organ Psychol Organ Behav 6: 145-169. https://doi.org/10.1146/annurev-orgpsych-012218-015212
|
| [57] | Friganović A, Selič P, Ilić B, et al. (2019) Stress and burnout syndrome and their associations with coping and job satisfaction in critical care nurses: a literature review. Psychiatr Danub 31: 21-31. |
| [58] |
Hodkinson A, Zhou A, Johnson J, et al. (2022) Associations of physician burnout with career engagement and quality of patient care: Systematic review and meta-analysis. BMJ 378: e070442. https://doi.org/10.1136/bmj-2022-070442
|
| [59] |
Özkan AH (2022) The effect of burnout and its dimensions on turnover intention among nurses: A meta-analytic review. J Nurs Manag 30: 660-669. https://doi.org/10.1111/jonm.13525
|
 publichealth-10-04-055-s001.pdf publichealth-10-04-055-s001.pdf |
 |

Figures(2) / Tables(5)

Petros Galanis, Aglaia Katsiroumpa, Irene Vraka, Olga Siskou, Olympia Konstantakopoulou, Ioannis Moisoglou, Parisis Gallos, Daphne Kaitelidou. The quiet quitting scale: Development and initial validation[J]. AIMS Public Health, 2023, 10(4): 828-848. doi: 10.3934/publichealth.2023055


 DownLoad: