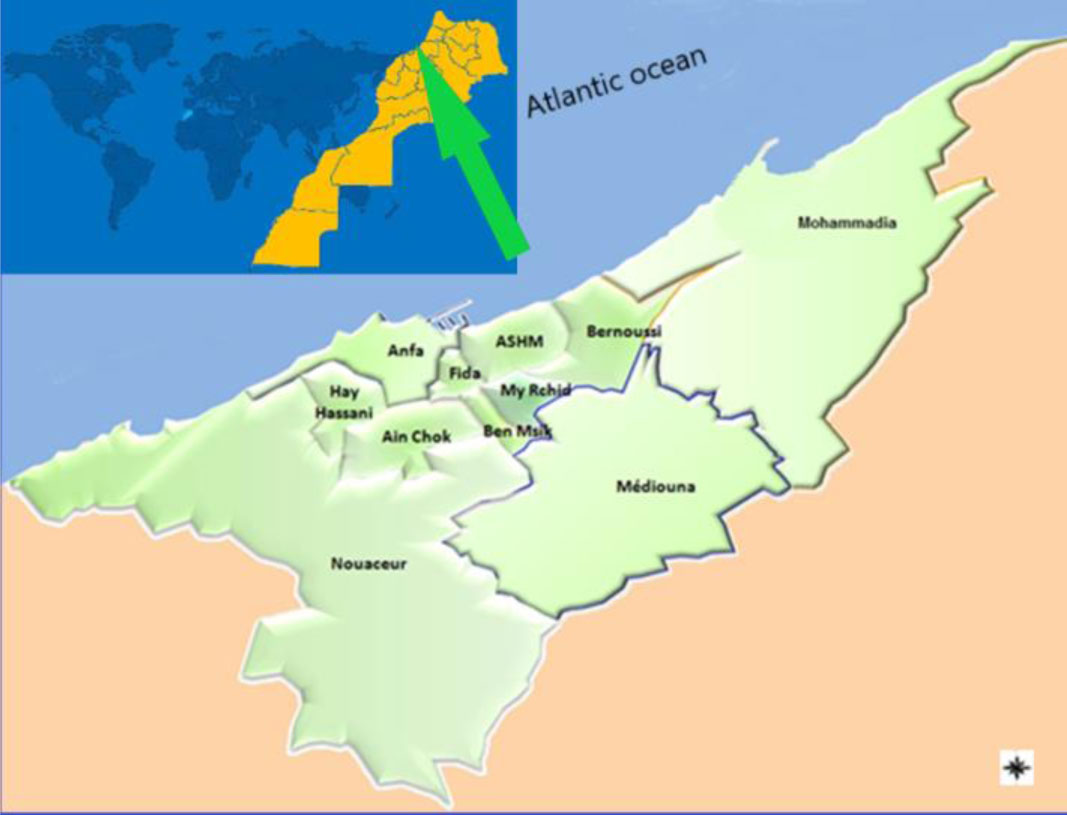
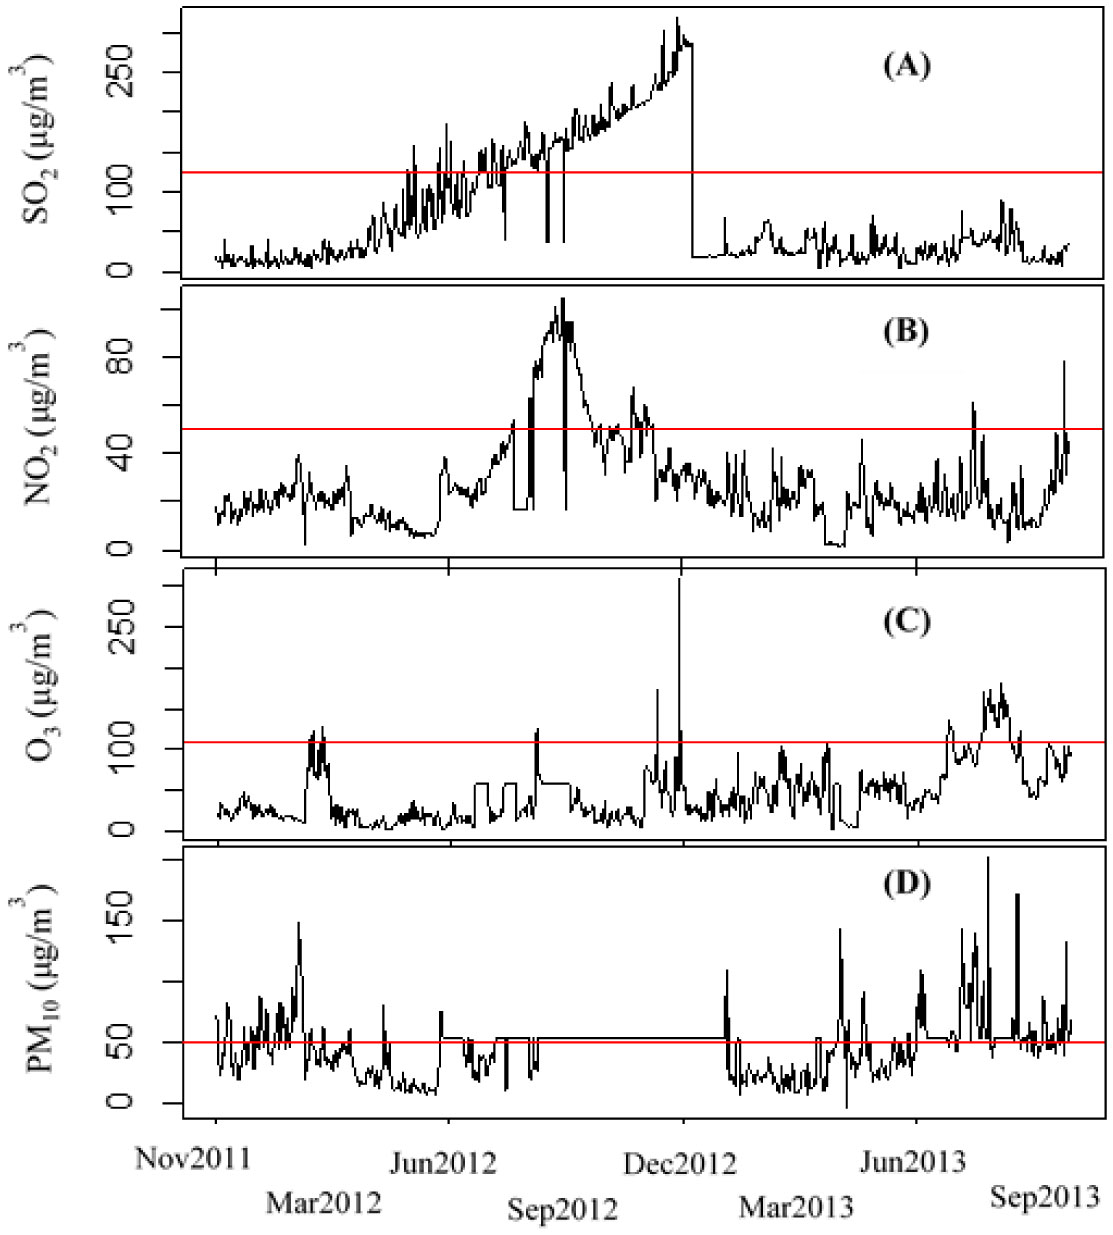
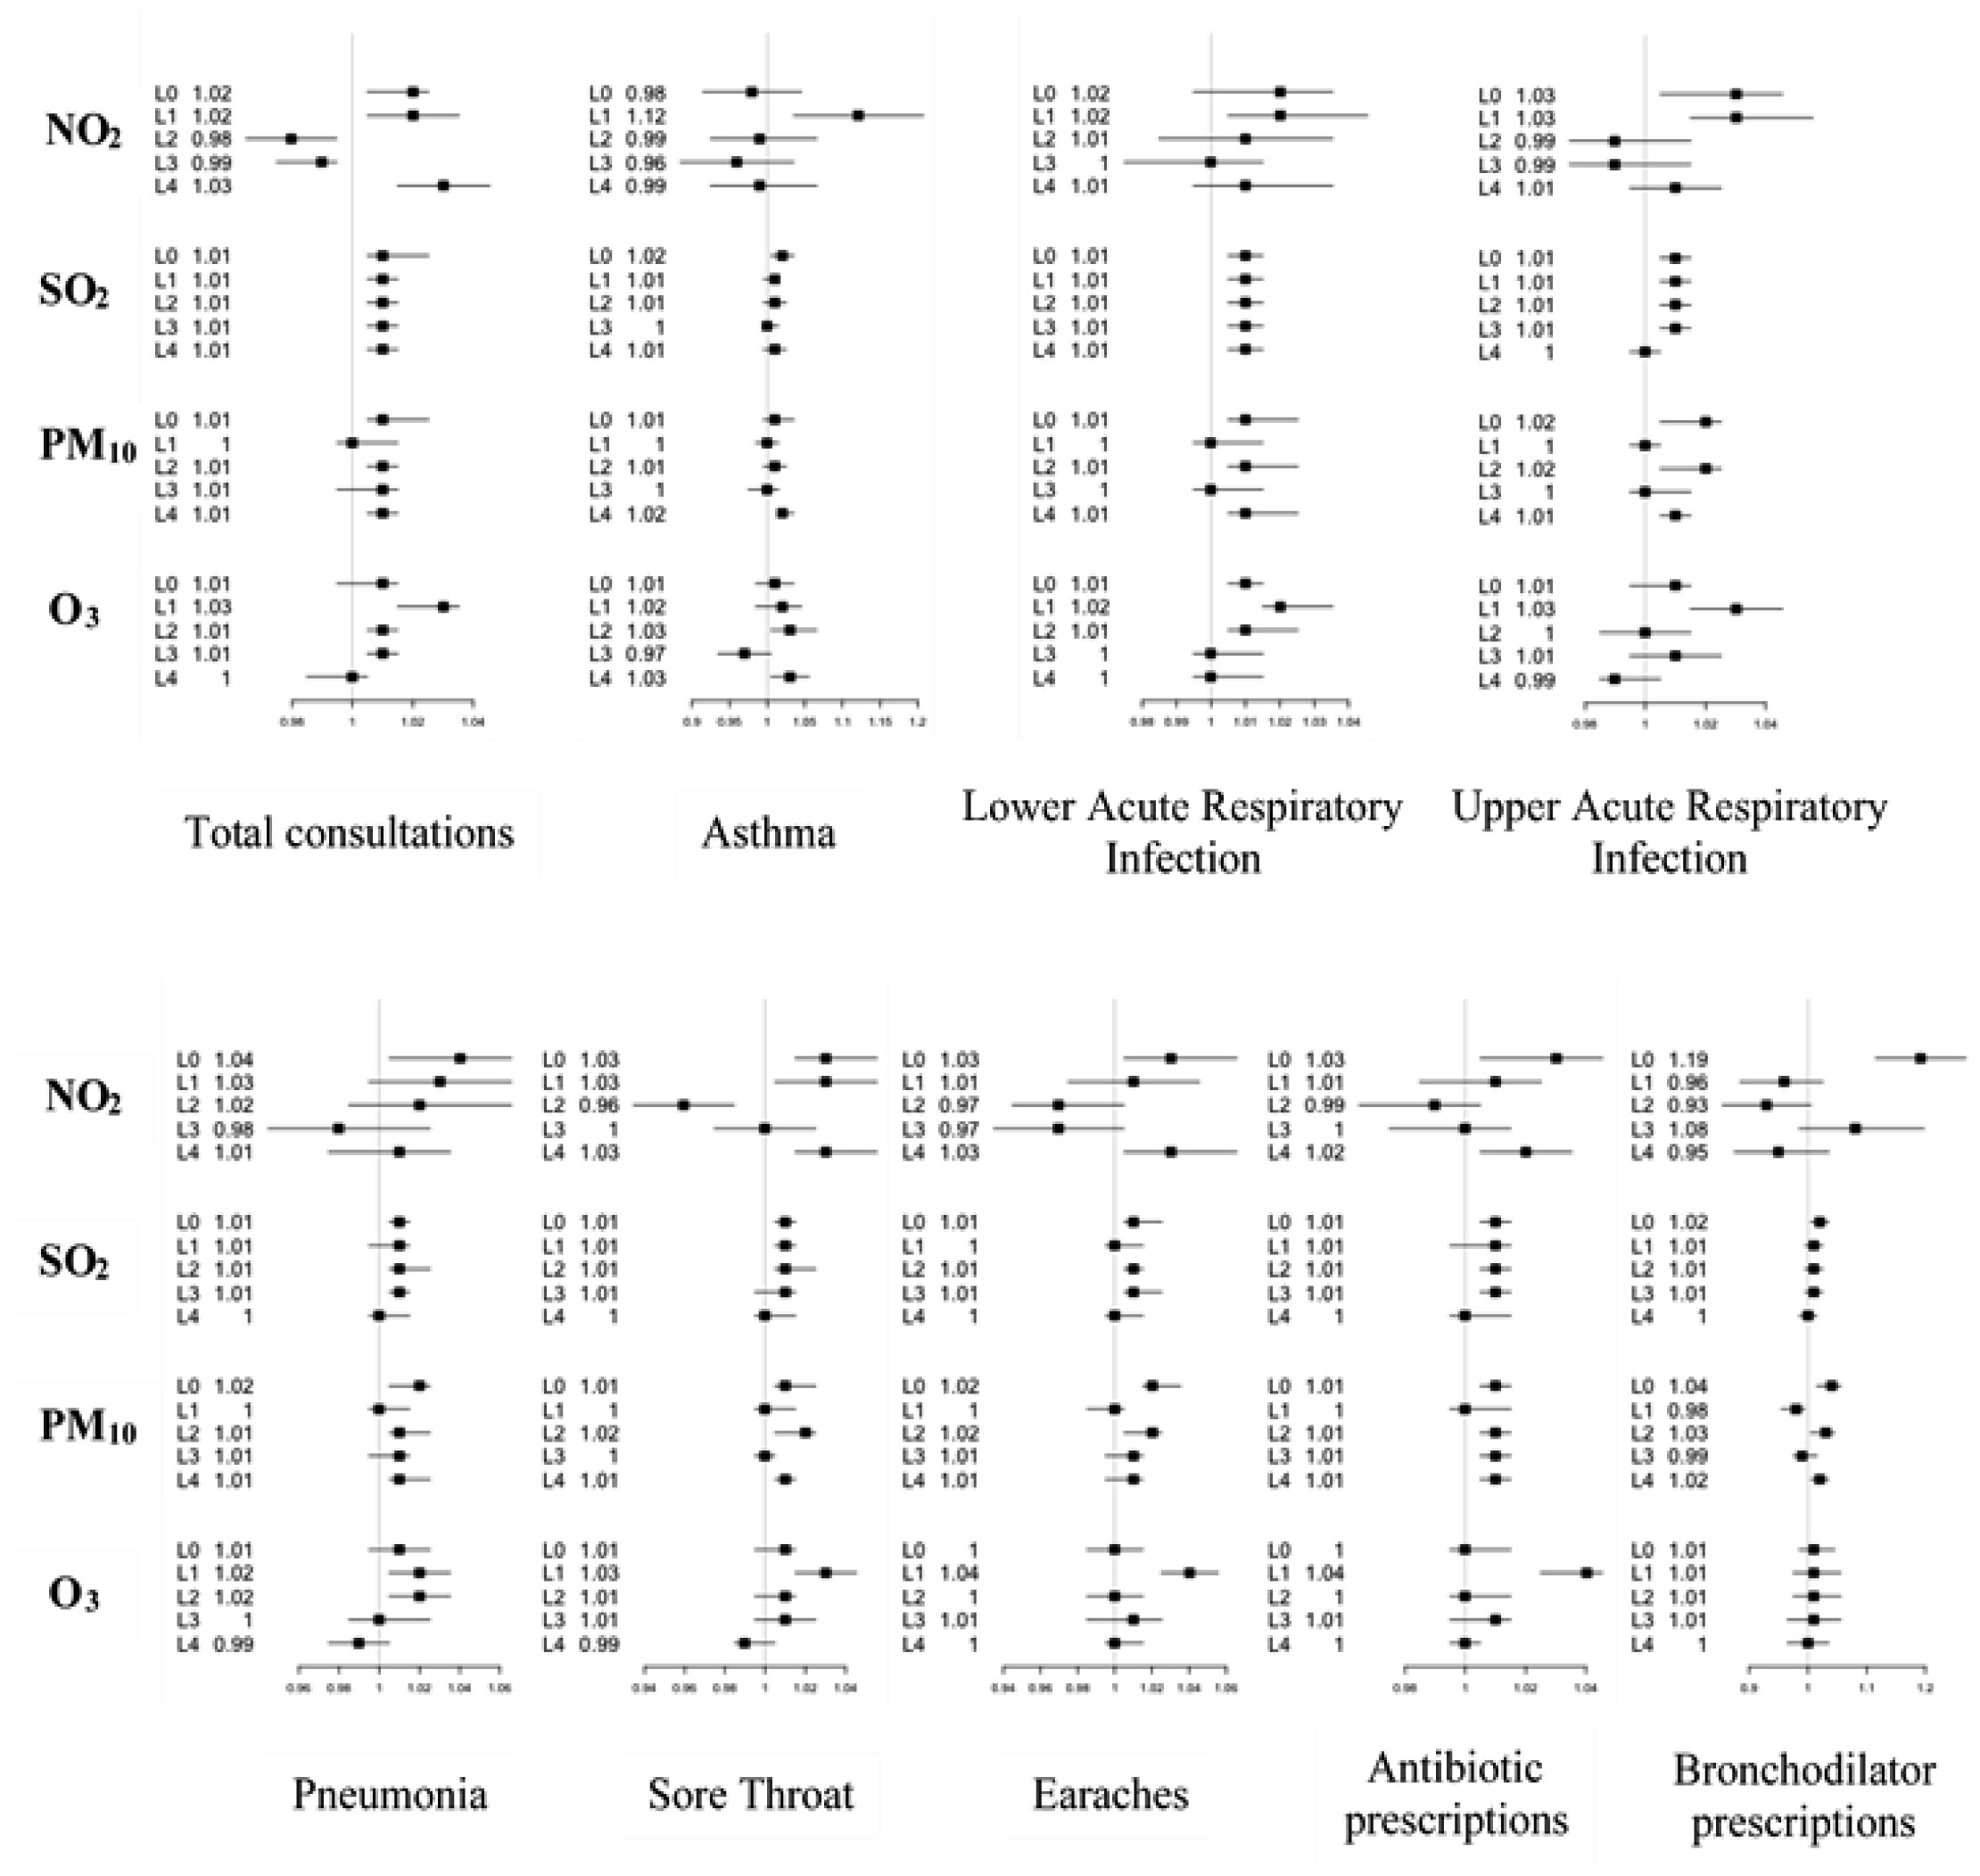
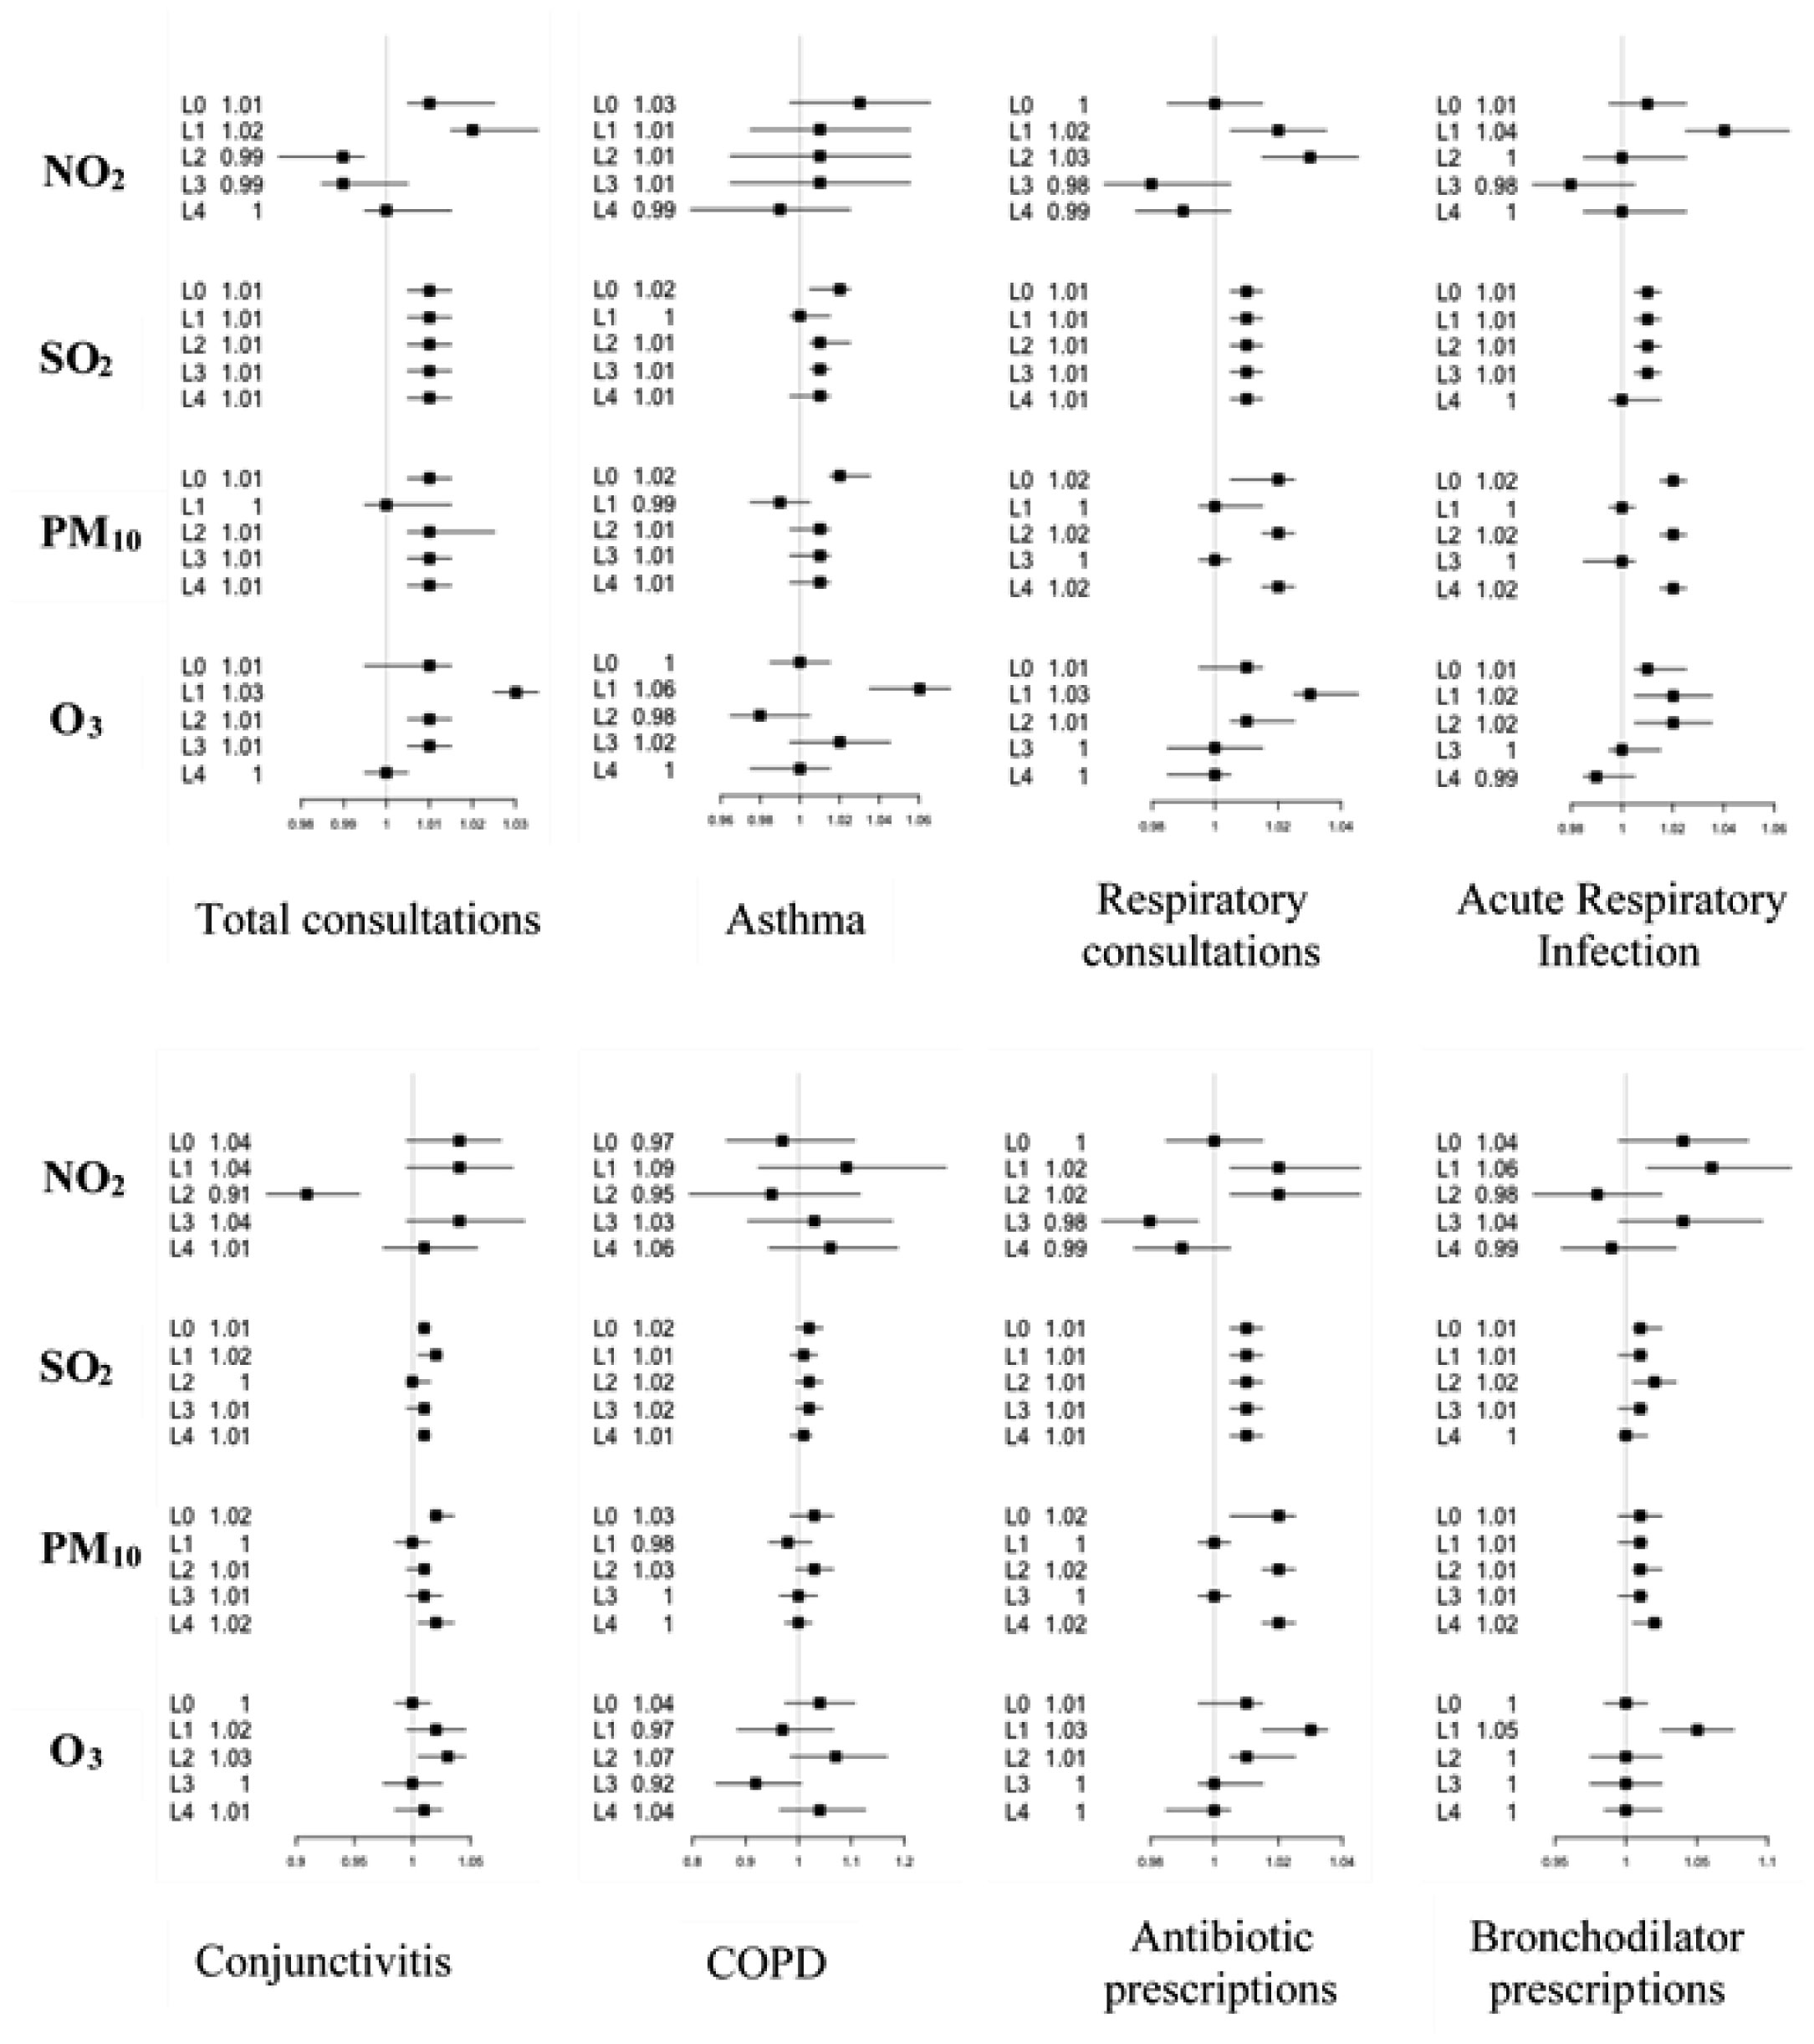
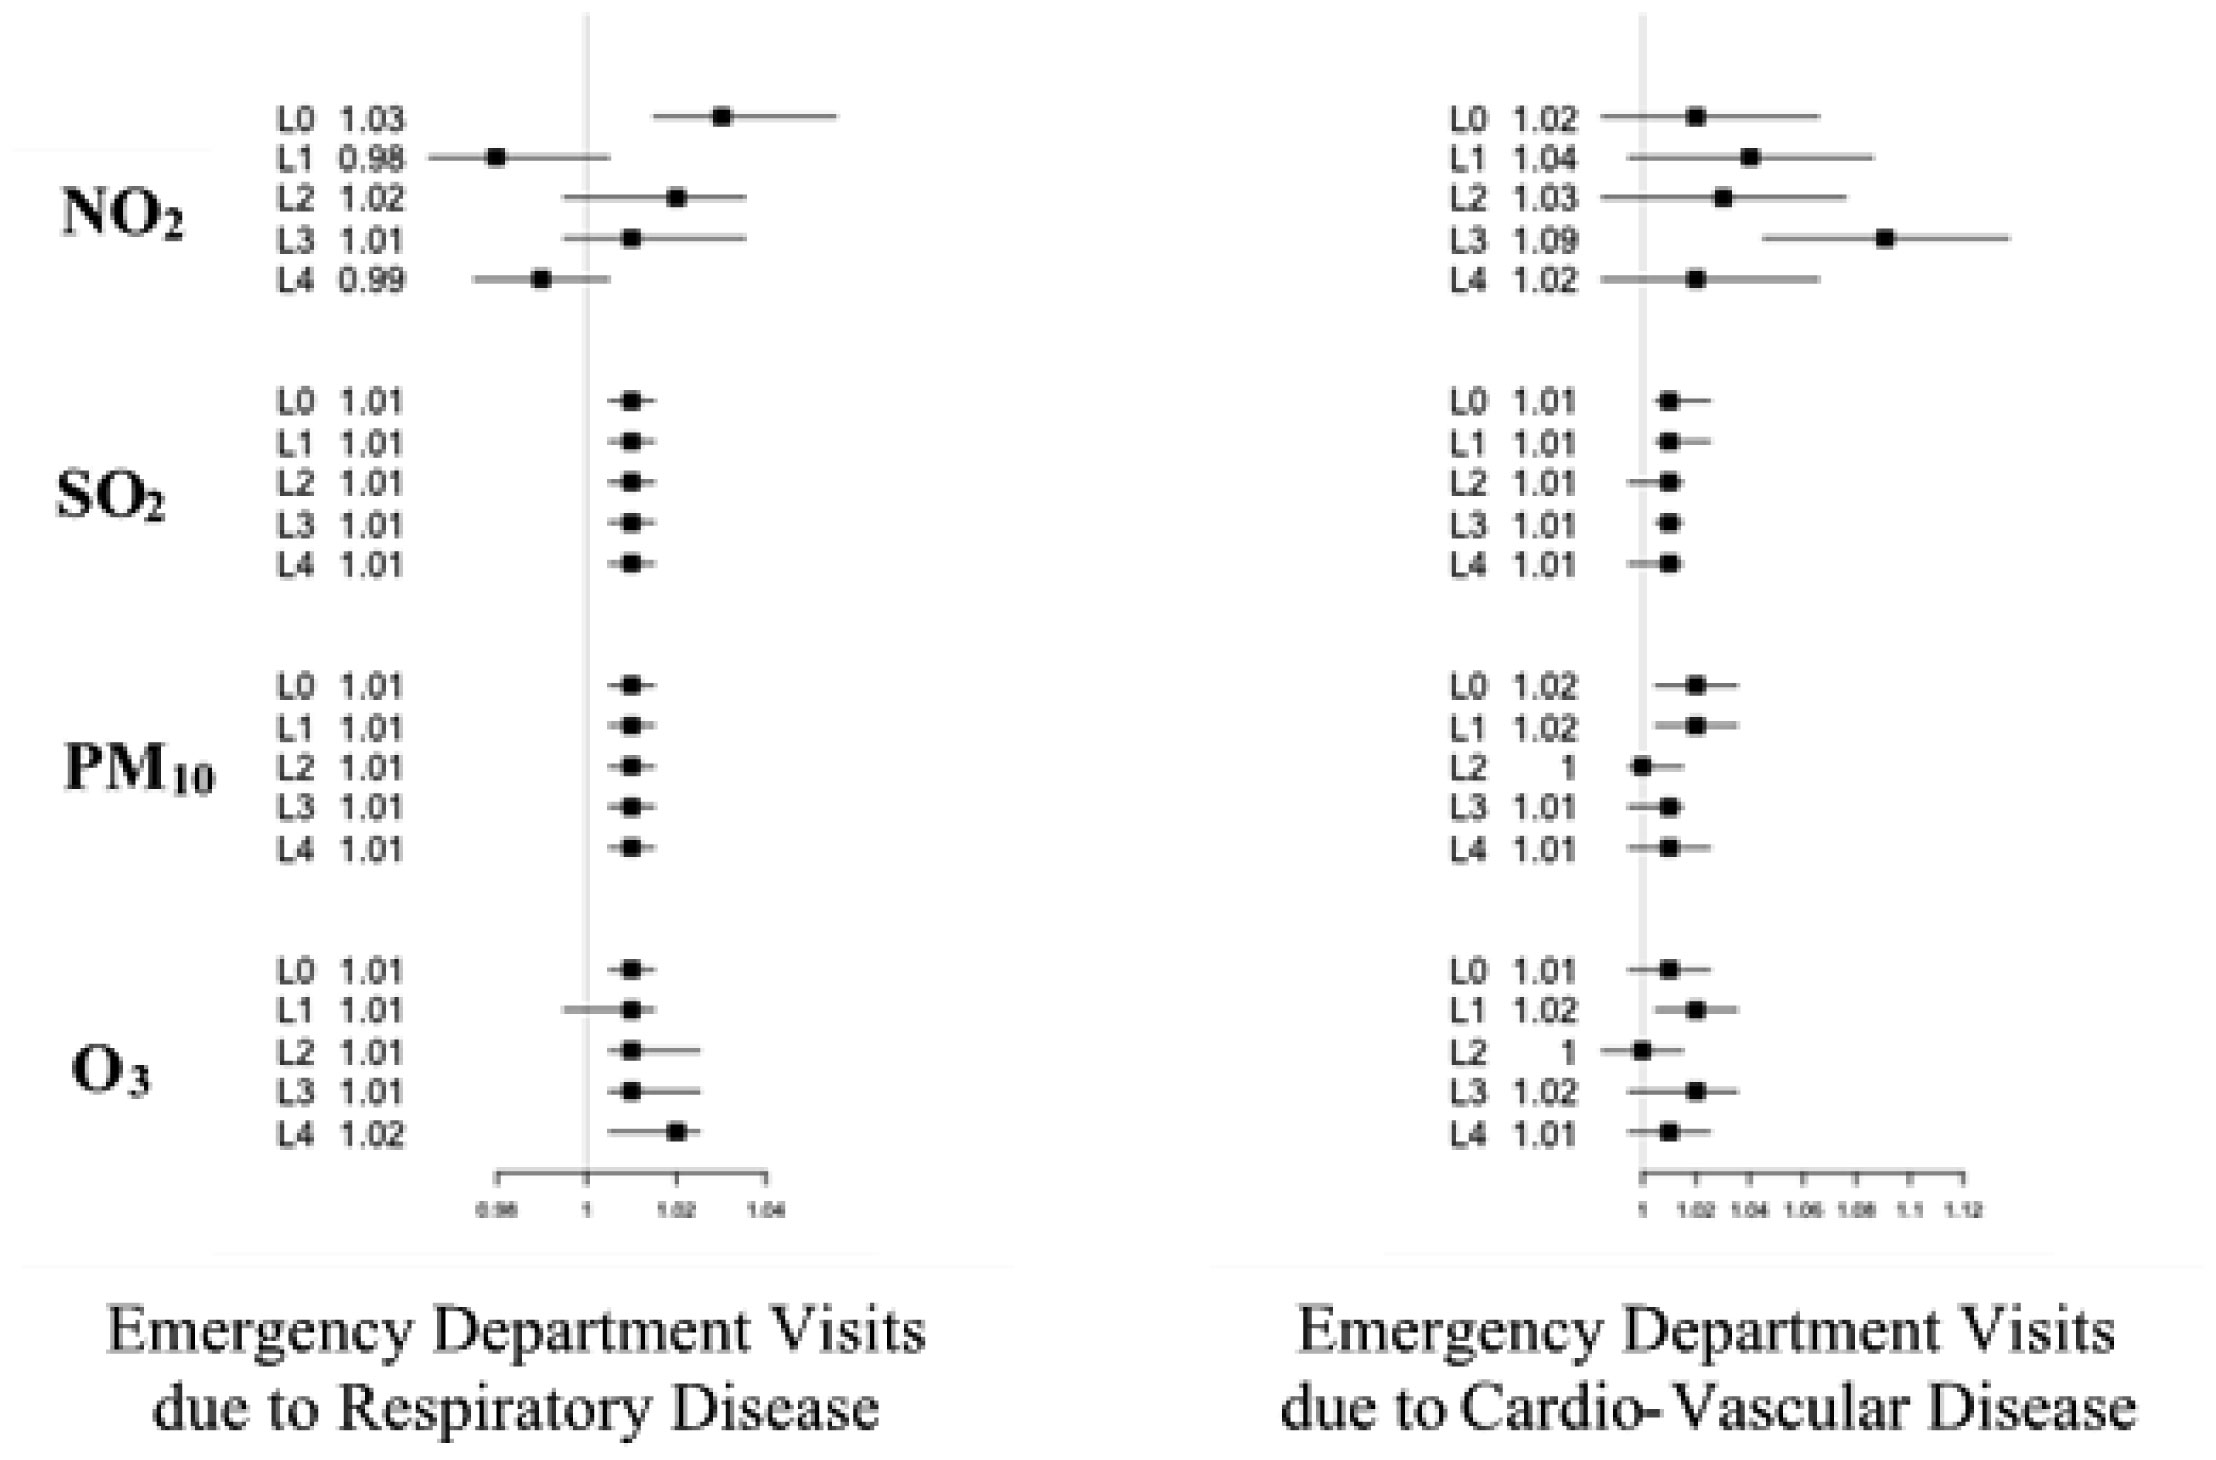
This study presents the relationships between ambient air pollutants and morbidity and emergency department visits among children and adults performed in Great Casablanca, the most populated and economic region in Morocco. This research was analyzed using conditional Poisson model for the period 2011–2013. In the period of study, the daily average concentrations of SO2, NO2, O3 and PM10 in Casablanca were 209.4 µg/m3, 61 µg/m3, 113.2 µg/m3 and 75.1 µg/m3, respectively. In children less than 5 years old, risk of asthma could be increased until 12% per 10 µg/m3 increase in NO2, PM10, SO2 and O3. In children over 5 years and adults, an increase of 10 µg/m3 air pollutant can cause an increase until 3% and 4% in respiratory consultations and acute respiratory infection, respectively. Similarly, impact on emergency department visits due to respiratory and cardiac illness was established. Our results suggest a not negligible impact on morbidity of outdoor air pollution by NO2, SO2, O3, and PM10.
Citation: Chakib Nejjari, Abdelghafour Marfak, Ahmed Rguig, Abderrahmane Maaroufi, Ihssane El Marouani, Abderrafii El Haloui, Bouchra El Johra, Rachid Ouahabi, Rachid Moulki, Amina Idrissi Azami, Youness El Achhab. Ambient air pollution and emergency department visits among children and adults in Casablanca, Morocco[J]. AIMS Public Health, 2021, 8(2): 285-302. doi: 10.3934/publichealth.2021022
This study presents the relationships between ambient air pollutants and morbidity and emergency department visits among children and adults performed in Great Casablanca, the most populated and economic region in Morocco. This research was analyzed using conditional Poisson model for the period 2011–2013. In the period of study, the daily average concentrations of SO2, NO2, O3 and PM10 in Casablanca were 209.4 µg/m3, 61 µg/m3, 113.2 µg/m3 and 75.1 µg/m3, respectively. In children less than 5 years old, risk of asthma could be increased until 12% per 10 µg/m3 increase in NO2, PM10, SO2 and O3. In children over 5 years and adults, an increase of 10 µg/m3 air pollutant can cause an increase until 3% and 4% in respiratory consultations and acute respiratory infection, respectively. Similarly, impact on emergency department visits due to respiratory and cardiac illness was established. Our results suggest a not negligible impact on morbidity of outdoor air pollution by NO2, SO2, O3, and PM10.
Upper Acute Respiratory Infection
lower acute respiratory infection
Pneumonia
Severe Pneumonia
Sore Throat
Very Serious Diseases
Respiratory Consultations (RC)
Acute Respiratory Disease
Emergency Department Visits
World Health Organization
Great Casablanca
Exceeding Standard Ratio
Chronic Obstructive Pulmonary Disease

| [1] |
Lai HK, Tsang H, Wong CM (2013) Meta-analysis of adverse health effects due to air pollution in Chinese populations. BMC Public Health 13: 360. doi: 10.1186/1471-2458-13-360

|
| [2] |
Kelly FJ, Fussell JC (2015) Air pollution and public health: emerging hazards and improved understanding of risk. Environ Geochem Health 37: 631-649. doi: 10.1007/s10653-015-9720-1
|
| [3] |
Jiang XQ, Mei XD, Feng D (2016) Air pollution and chronic airway diseases: what should people know and do? J Thorac Dis 8: E31-E40. doi: 10.21037/jtd.2016.08.40
|
| [4] | World Health Organization Burden of disease from air pollution (2014) .Available from: https://www.who.int/phe/health_topics/outdoorair/databases/FINAL_HAP_AAP_BoD_24March2014.pdf. |
| [5] |
Song Q, Christiani DC, Wang XR, et al. (2014) The global contribution of outdoor air pollution to the incidence, prevalence, mortality and hospital admission for chronic obstructive pulmonary disease: a systematic review and meta-analysis. Int J Environ Res Public Health 11: 11822-11832. doi: 10.3390/ijerph111111822
|
| [6] |
Männistö T, Mendola P, Laughon Grantz K, et al. (2015) Acute and recent air pollution exposure and cardiovascular events at labour and delivery. Heart 101: 1491-1498. doi: 10.1136/heartjnl-2014-307366
|
| [7] |
Stevanović I, Jovasević-Stojanović M, Stosić JJ (2016) Association between ambient air pollution, meteorological conditions and exacerbations of asthma and chronic obstructive pulmonary disease in adult citizens of the town of Smederevo. Vojnosanit Pregl 73: 152-158. doi: 10.2298/VSP141111026S
|
| [8] |
Hoek G, Krishnan RM, Beelen R, et al. (2013) Long-term air pollution exposure and cardio-respiratory mortality: a review. Environ Health 12: 43. doi: 10.1186/1476-069X-12-43
|
| [9] |
Pascal M, Corso M, Chanel O, et al. (2013) Assessing the public health impacts of urban air pollution in 25 European cities: results of the Aphekom project. Sci Total Environ 449: 390-400. doi: 10.1016/j.scitotenv.2013.01.077
|
| [10] | World Health Organization Ambient (outdoor) air quality and health (2018) .Available from: https://www.who.int/news-room/fact-sheets/detail/ambient-(outdoor)-air-quality-and-health. |
| [11] |
Franklin BA, Brook R, Arden PC (2015) Air pollution and cardiovascular disease. Curr Probl Cardiol 40: 207-238. doi: 10.1016/j.cpcardiol.2015.01.003
|
| [12] | WHO Burden of disease from Household Air Pollution for 2012 (2014) .Available from: https://www.who.int/phe/health_topics/outdoorair/databases/FINAL_HAP_AAP_BoD_24March2014.pdf. |
| [13] |
Hao Y, Balluz L, Strosnider H, et al. (2015) Ozone, Fine Particulate Matter, and Chronic Lower Respiratory Disease Mortality in the United States. Am J Respir Crit Care Med 192: 337-341. doi: 10.1164/rccm.201410-1852OC
|
| [14] |
Pirozzi C, Sturrock A, Weng HY, et al. (2015) Effect of naturally occurring ozone air pollution episodes on pulmonary oxidative stress and inflammation. Int J Environ Res Public Health 12: 5061-5075. doi: 10.3390/ijerph120505061
|
| [15] |
Petito Boyce C, Goodman JE, Sax SN, et al. (2015) Providing perspective for interpreting cardiovascular mortality risks associated with ozone exposures. Regul Toxicol Pharmacol 72: 107-116. doi: 10.1016/j.yrtph.2015.03.009
|
| [16] |
Mills IC, Atkinson RW, Kang S, et al. (2015) Quantitative systematic review of the associations between short-term exposure to nitrogen dioxide and mortality and hospital admissions. BMJ Open 5: e006946. doi: 10.1136/bmjopen-2014-006946
|
| [17] |
Chen R, Huang W, Wong CM, et al. (2012) Short-term exposure to sulfur dioxide and daily mortality in 17 Chinese cities: the China air pollution and health effects study (CAPES). Environ Res 118: 101-106. doi: 10.1016/j.envres.2012.07.003
|
| [18] | Zhang Y, Wang SG, Ma YX, et al. (2015) Association between Ambient Air Pollution and Hospital Emergency Admissions for Respiratory and Cardiovascular Diseases in Beijing: a Time Series Study. Biomed Environ Sci 28: 352-363. |
| [19] |
Norbäck D, Lu C, Zhang Y, et al. (2019) Sources of indoor particulate matter (PM) and outdoor air pollution in China in relation to asthma, wheeze, rhinitis and eczema among pre-school children: Synergistic effects between antibiotics use and PM10 and second hand smoke. Environ Int 125: 252-260. doi: 10.1016/j.envint.2019.01.036
|
| [20] |
Zhu Y, Xie J, Huang F, et al. (2020) Association between short-term exposure to air pollution and COVID-19 infection: Evidence from China. Sci Total Environ 727: 138704. doi: 10.1016/j.scitotenv.2020.138704
|
| [21] | Srivastava A (2020) COVID-19 and air pollution and meteorology-an intricate relationship: A review. Chemosphere 5: 128297. |
| [22] |
Coccia M (2021) The effects of atmospheric stability with low wind speed and of air pollution on the accelerated transmission dynamics of COVID-19. Int J Environ Stud 78: 1-27. doi: 10.1080/00207233.2020.1802937
|
| [23] | Coccia M (2021) Effects of the spread of COVID-19 on public health of polluted cities: results of the first wave for explaining the dejà vu in the second wave of COVID-19 pandemic and epidemics of future vital agents. SSRN Electron J . |
| [24] |
Coccia M (2020) How do low wind speeds and high levels of air pollution support the spread of COVID-19? Atmos Pollut Res 12: 437-445. doi: 10.1016/j.apr.2020.10.002
|
| [25] |
Coccia M (2020) How (Un) sustainable Environments Are Related to the Diffusion of COVID-19: The Relation between Coronavirus Disease 2019, Air Pollution, Wind Resource and Energy. Sustainability 12: 9709. doi: 10.3390/su12229709
|
| [26] |
Coccia M (2020) An index to quantify environmental risk of exposure to future epidemics of the COVID-19 and similar viral agents: Theory and Practice. Environ Res 191: 110155. doi: 10.1016/j.envres.2020.110155
|
| [27] |
Khatami A, Ponche JL, Jabry E, et al. (1998) The air quality management of the region of Great Casablanca (Morocco). Part 1: Atmospheric emission inventory for the year 1992. Sci Total Environ 209: 201-216. doi: 10.1016/S0048-9697(97)00307-0
|
| [28] | International Business Publications (IBP), USA 2017 Morocco country study guide Washington, DC 20043 Available from: http://www.internationalbusiness.infoalbum.com/269-1734684910/IB_Morocco_17.v02.pdf. |
| [29] | Nejjari C, Filleul L, Zidouni N, et al. (2003) Air pollution: a new respiratory risk for cities in low-income countries. Int J Tuberc Lung Dis 7: 223-231. |
| [30] | Hastie T, Tibshirani R (1986) Generalized Additive Models. Stat Sci 1: 297-318. |
| [31] |
Peng RD, Dominici F, Louis TA (2006) Model choice in time series studies of air pollution and mortality. J R Stat Soc Ser A 169: 179-203. doi: 10.1111/j.1467-985X.2006.00410.x
|
| [32] |
Dominici F, Peng RD, Bell ML, et al. (2006) Fine particulate air pollution and hospital admission for cardiovascular and respiratory diseases. JAMA 295: 1127-1134. doi: 10.1001/jama.295.10.1127
|
| [33] |
Armstrong B, Gasparrini A, Tobias A (2014) Conditional Poisson models: a flexible alternative to conditional logistic case cross-over analysis. BMC Med Res Methodol 14: 122-127. doi: 10.1186/1471-2288-14-122
|
| [34] |
Akaike H (1970) Statistical predictor identification. Ann Inst Statist Math 22: 203-217. doi: 10.1007/BF02506337
|
| [35] |
Li N, Buglak N (2015) Convergence of air pollutant-induced redox-sensitive signals in the dendritic cells contributes to asthma pathogenesis. Toxicol Lett 237: 55-60. doi: 10.1016/j.toxlet.2015.05.017
|
| [36] |
Jang AS, Jun YJ, Park MK (2016) Effects of air pollutants on upper airway disease. Curr Opin Allergy Clin Immunol 16: 13-17. doi: 10.1097/ACI.0000000000000235
|
| [37] |
Hajat S, Haines A, Atkinson RW, et al. (2001) Association between air pollution and daily consultations with general practitioners for allergic rhinitis in London, United Kingdom. Am J Epidemiol 153: 704-714. doi: 10.1093/aje/153.7.704
|
| [38] |
Zanobetti A, Schwartz J, Dockery DW (2000) Airborne particles are a risk factor for hospital admissions for heart and lung disease. Environ Health Perspect 108: 1071-1077. doi: 10.1289/ehp.001081071
|
| [39] |
Badyda A, Gayer A, Czechowski PO, et al. (2016) Pulmonary Function and Incidence of Selected Respiratory Diseases Depending on the Exposure to Ambient PM(10). Int J Mol Sci 17: 1954. doi: 10.3390/ijms17111954
|
| [40] |
Hajat S, Haines A, Goubet SA, et al. (1999) Association of air pollution with daily GP consultations for asthma and other lower respiratory conditions in London. Thorax 54: 597-605. doi: 10.1136/thx.54.7.597
|
| [41] |
Rosenlund M, Forastiere F, Porta D, et al. (2009) Traffic-related air pollution in relation to respiratory symptoms, allergic sensitisation and lung function in schoolchildren. Thorax 64: 573-580. doi: 10.1136/thx.2007.094953
|
| [42] |
Barone-Adesi F, Dent JE, Dajnak D, et al. (2015) Long-Term Exposure to Primary Traffic Pollutants and Lung Function in Children: Cross-Sectional Study and Meta-Analysis. PLoS One 10: e0142565. doi: 10.1371/journal.pone.0142565
|
| [43] |
Brauer M (2010) How much, how long, what, and where: air pollution exposure assessment for epidemiologic studies of respiratory disease. Proc Am Thorac Soc 7: 111-115. doi: 10.1513/pats.200908-093RM
|
| [44] |
Clark NA, Demers PA, Karr CJ, et al. (2010) Effect of early life exposure to air pollution on development of childhood asthma. Environ Health Perspect 118: 284-290. doi: 10.1289/ehp.0900916
|
| [45] |
Liu P, Wang X, Fan J, et al. (2016) Effects of Air Pollution on Hospital Emergency Room Visits for Respiratory Diseases: Urban-Suburban Differences in Eastern China. Int J Environ Res Public Health 13: 341. doi: 10.3390/ijerph13030341
|
| [46] |
Pannullo F, Lee D, Neal L, et al. (2017) Quantifying the impact of current and future concentrations of air pollutants on respiratory disease risk in England. Environ Health 16: 29. doi: 10.1186/s12940-017-0237-1
|
| [47] |
Atkinson RW, Carey IM, Kent AJ, et al. (2013) Long-term exposure to outdoor air pollution and incidence of cardiovascular diseases. Epidemiology 24: 44-53. doi: 10.1097/EDE.0b013e318276ccb8
|
| [48] |
Liu L, Kauri LM, Mahmud M, et al. (2014) Exposure to air pollution near a steel plant and effects on cardiovascular physiology: a randomized crossover study. Int J Hyg Environ Health 217: 279-286. doi: 10.1016/j.ijheh.2013.06.007
|
| [49] |
Atzori L, Bannenberg G, Corriga AM, et al. (1992) Sulfur dioxide-induced bronchoconstriction via ruthenium red-sensitive activation of sensory nerves. Respiration 59: 272-278. doi: 10.1159/000196072
|
| [50] | Chen SS, Tang CS, Jin HF, et al. (2011) Sulfur dioxide acts as a novel endogenous gaseous signaling molecule in the cardiovascular system. Chin Med J 124: 1901-1905. |
| [51] |
Guan WJ, Zheng XY, Chung KF, et al. (2016) Impact of air pollution on the burden of chronic respiratory diseases in China: time for urgent action. Lancet 388: 1939-1951. doi: 10.1016/S0140-6736(16)31597-5
|
| [52] | Huang Y, Tang C, Du J, et al. (2016) Endogenous Sulfur Dioxide: A New Member of Gasotransmitter Family in the Cardiovascular System. Oxid Med Cell Longev 2016: 8961951. |
| [53] |
Goodman JE, Prueitt RL, Sax SN, et al. (2014) Weight-of-evidence evaluation of short-term ozone exposure and cardiovascular effects. Crit Rev Toxicol 44: 725-790. doi: 10.3109/10408444.2014.937854
|
| [54] |
Prueitt RL, Lynch HN, Zu K, et al. (2014) Weight-of-evidence evaluation of long-term ozone exposure and cardiovascular effects. Crit Rev Toxicol 44: 791-822. doi: 10.3109/10408444.2014.937855
|
| [55] |
Arjomandi M, Wong H, Donde A, et al. (2015) Exposure to medium and high ambient levels of ozone causes adverse systemic inflammatory and cardiac autonomic effects. Am J Physiol Heart Circ Physiol 308: H1499. doi: 10.1152/ajpheart.00849.2014
|
| [56] |
Ong CB, Kumagai K, Brooks PT, et al. (2016) Ozone-Induced Type 2 Immunity in Nasal Airways. Development and Lymphoid Cell Dependence in Mice. Am J Respir Cell Mol Biol 54: 331-340. doi: 10.1165/rcmb.2015-0165OC
|
| [57] |
Hwang BF, Chen YH, Lin YT, et al. (2015) Relationship between exposure to fine particulates and ozone and reduced lung function in children. Environ Res 137: 382-390. doi: 10.1016/j.envres.2015.01.009
|
| [58] |
Pride KR, Peel JL, Robinson BF, et al. (2015) Association of short-term exposure to ground-level ozone and respiratory outpatient clinic visits in a rural location - Sublette County, Wyoming, 2008–2011. Environ Res 137: 1-7. doi: 10.1016/j.envres.2014.10.033
|
| [59] |
Bourdrel T, Annesi-Maesano I, Alahmad B, et al. (2021) The impact of outdoor air pollution on COVID-19: a review of evidence from in vitro, animal, and human studies. Eur Respiratory Rev 30: 200242. doi: 10.1183/16000617.0242-2020
|
| [60] |
Ali N, Islam F (2020) The Effects of Air Pollution on COVID-19 Infection and Mortality - A Review on Recent Evidence. Front Public Health 8: 580057. doi: 10.3389/fpubh.2020.580057
|
| [61] |
Bashir MF, Jiang B, Komal B, et al. (2020) Correlation between environmental pollution indicators and COVID-19 pandemic: a brief study in Californian context. Environ Res 187: 109652. doi: 10.1016/j.envres.2020.109652
|
| [62] |
Bianconi V, Bronzo P, Banach M, et al. (2020) Particulate matter pollution and the COVID-19 outbreak: results from Italian regions and provinces. Arch Med Sci 16: 985. doi: 10.5114/aoms.2020.95336
|
| [63] |
Ogen Y (2020) Assessing nitrogen dioxide (NO2) levels as a contributing factor to coronavirus (COVID-19) fatality. Sci Total Environ 726: 138605. doi: 10.1016/j.scitotenv.2020.138605
|
| [64] |
Fattorini D, Regoli F (2020) Role of the chronic air pollution levels in the Covid-19 outbreak risk in Italy. Environ Pollut 264: 114732. doi: 10.1016/j.envpol.2020.114732
|
Figures(5) / Tables(5)

Chakib Nejjari, Abdelghafour Marfak, Ahmed Rguig, Abderrahmane Maaroufi, Ihssane El Marouani, Abderrafii El Haloui, Bouchra El Johra, Rachid Ouahabi, Rachid Moulki, Amina Idrissi Azami, Youness El Achhab. Ambient air pollution and emergency department visits among children and adults in Casablanca, Morocco[J]. AIMS Public Health, 2021, 8(2): 285-302. doi: 10.3934/publichealth.2021022


 DownLoad: