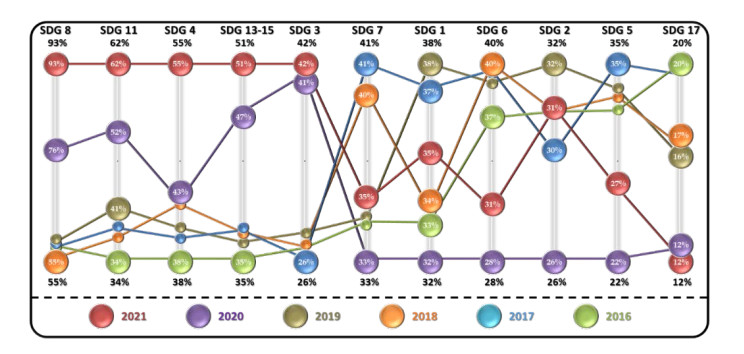
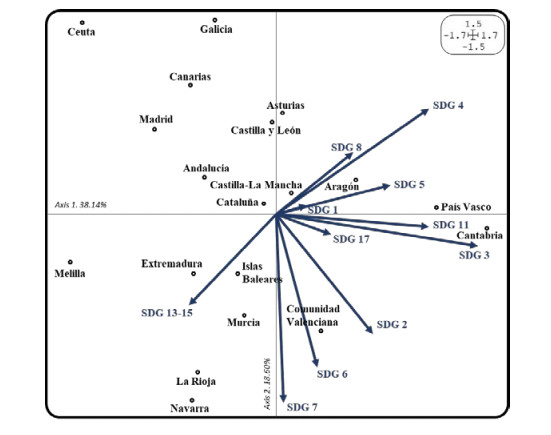
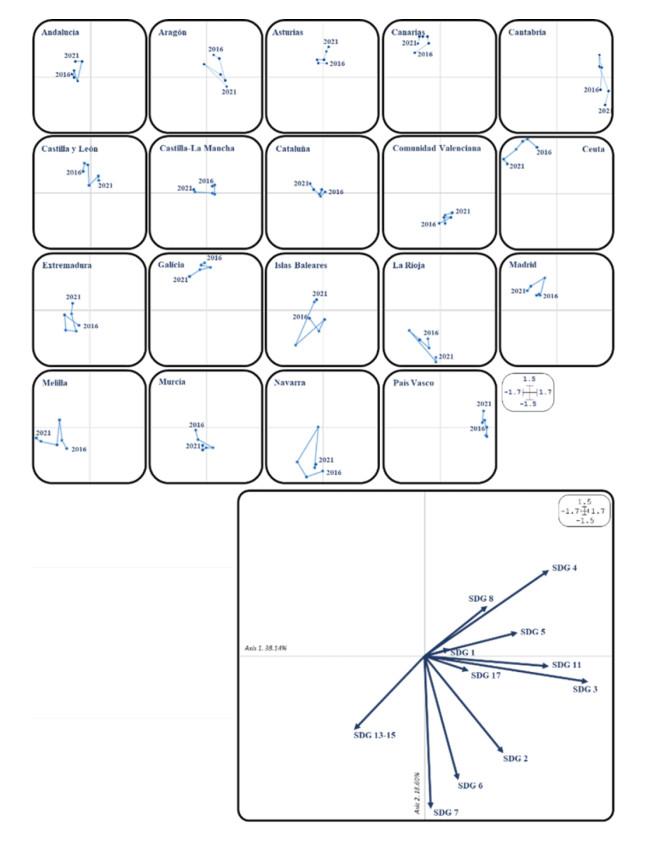
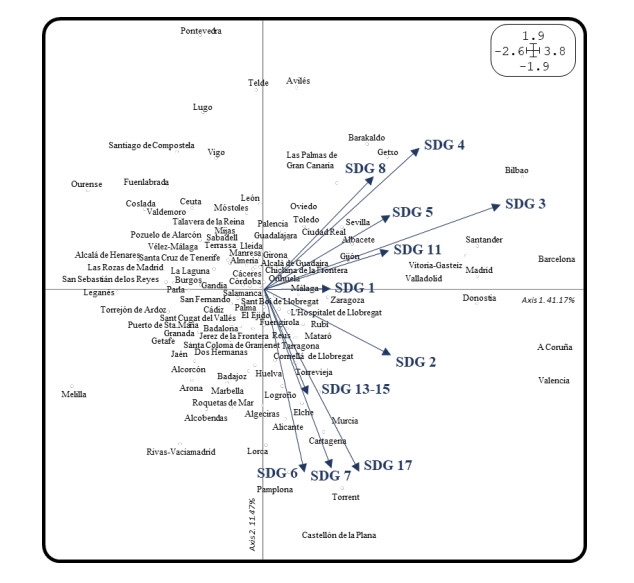
1.
Introduction
In order to achieve the total sustainability of the planet, the prosperity of the population and the eradication of poverty, the United Nations (UN) approved in 2015 the 2030 Agenda for Sustainable Development, which is a global agenda that includes a comprehensive set of 17 challenging and interdependent objectives called Sustainable Development Goals (SDGs), representing the various dimensions and elements of sustainability [1], which member countries will have to meet by 2030 [2]. Under the slogan 'leave no one behind', this ambitious global agenda requires the collaboration of private companies, citizens, civil organizations, international organizations and governments [3].
'Localization of global sustainability goals' is key in addressing sustainability challenges [4]. In this sense, SDG localization refers to "the process of defining, implementing, and monitoring strategies at the local level for achieving global, national, and subnational sustainable development goals. This involves concrete mechanisms, tools, innovations, platforms, and processes to effectively translate the development agenda into results at the local level" [5]. This is not a new concept, as various initiatives to promote sustainability on a local scale have been undertaken over the last three decades, and it was emphasized as a basic need in the mid-term review of the Millennium Development Goals [6].
The achievement of a significant percentage of the targets set for each SDG (up to 65%) requires the involvement of local governments [7]. In this sense, the leading role of regional and local governments (i.e., subnational entities) in the implementation and achievement of the SDGs is recognized in the 2030 Agenda [8,9], highlighting the importance of multi-level collaboration among governments [1] to integrate the SDGs into public policies and budgets [10]. Furthermore, governments must need to disclose information to their different stakeholders on actions related to the SDGs that are being carried out and the results achieved [11].
Achieving the SDGs requires knowing how and to what extent local governments have committed to the 2030 Agenda by implementing actions to address these challenges [1]. However, several years after this global agenda was adopted, there is still limited knowledge about the degree of implementation of the SDGs by local governments and the initiatives developed in this regard [9]. In this vein, successful implementation of the SDGs at the local level requires research to fill the knowledge gap related to how the SDGs have been integrated into local strategies and policies [12]. In addition, to promote sustainability, it is necessary to analyze the interaction between local and regional actors [13]. This paper aims to fill this gap in literature. Thus, the objective of this paper was to analyze the status and dynamic evolution of SDG commitment in Spanish regional and local governments over the period of 2016–2021. The aim was to identify which actions related to the implementation of the SDGs are most important for municipalities and, conversely, which actions represent the main challenge to their future commitment, as well as to analyze the extent to which the commitment of local governments has varied over time. The focus on Spain is justified because of the high level of commitment acquired in relation to the 2030 Agenda to disclose this information, as is the case in other European countries that apply the Freedom of Information Act [14].
From the content analysis of the websites of 102 Spanish municipalities for the period of 2016–2021, and considering 60 information items related to actions aligned with the 2030 Agenda and the SDGs that can be implemented at the local level (balanced panel of 612 observations), the X-STATIS technique was applied to perform a multivariate analysis that includes two levels of analysis: (1) analysis by SDGs to determine on which SDGs local entities have focused their efforts and which ones have been addressed to a lesser extent throughout the study period, and (2) analysis by regions and entities to determine the extent to which these actions are linked to the contextual characteristics of the municipalities and the demands they make in the context of the 2030 Agenda.
The results show a poor commitment of the Spanish municipalities to the SDGs (37.2% on average), although there has been a notable increase over the period analyzed. We also observed differences in the priorities of the municipalities in terms of their emphasis on the different SDGs and their evolution over time. SDG8 and SDG11 stand out as the main priorities where municipalities' commitment has increased the most, while initiatives related to SDG5, SDG6 and SDG17 have lost momentum. The COVID-19 pandemic has marked a turning point in this regard, with greater importance being given to the SDGs that are more related to people and prosperity.
The call for city rankings and benchmarking studies on sustainability issues has increased in recent decades as a key tool to help citizens and public authorities to understand the level of sustainability of regions and municipalities, assess their performance in relation to different dimensions of sustainability and identify key challenges for future improvements [15]. Given that, depending on its specificities, each territory (municipality or region) has its own sustainability agenda according to its specificities [16]; this type of ranking favors the benchmarking and evaluation of sustainability performance, as well as of the public policies developed by the different regions and municipalities [17,18]. From this perspective, this paper contributes to the existing literature on the implementation of the 2030 Agenda in the public sector, especially in municipalities, by providing an overview of the status and dynamic evolution of the SDG commitment of Spanish regional and local governments over the period of 2016–2021. Our findings reflect the commitment of the largest Spanish local governments to SDG implementation and outline possible sociodemographic factors that may influence their implementation. This analysis is particularly useful in the case of the 2030 Agenda, because the complexity and diversity of the SDGs make it difficult to conduct a homogeneous analysis of the initiatives carried out by municipalities and regions mandated to achieve them [19].
The rest of the paper is structured as follows. Section 2 presents the theoretical background. Section 3 is devoted to explaining the characteristics of the study (population and sample, methodology, and variables). Section 4 presents the results, which are discussed in Section 5. Finally, Section 6 summarizes the main conclusions and implications of the results, as well as the limitations and further extensions of the study.
2.
Theoretical background
2.1. The United Nations' 2030 Agenda and Sustainable Development Goals: The role of local governments
The SDGs are a set of global goals adopted by the UN member states in 2015, as part of the 2030 Agenda to achieve a more sustainable future for the world. They consist of 17 goals and 169 targets, covering a wide range of issues, including hunger and poverty eradication, education, inequalities, gender, sustainable energy and climate action, and are built around five pillars, defined as the 5 Ps: People, Planet, Prosperity, Peace and Partnership [20]. These 17 global goals are as follows:
- SDG1: 'No poverty'
- SDG2: 'Zero hunger'
- SDG3: 'Good health and well-being'
- SDG4: 'Quality education'
- SDG5: 'Gender equality'
- SDG6: 'Clean water and sanitation'
- SDG7: 'Affordable and clean energy'
- SDG8: 'Decent work and economic growth'
- SDG9: 'Industry, innovation and infrastructure'
- SDG10: 'Reduced inequalities'
- SDG11: 'Sustainable cities and communities'
- SDG12: 'Responsible consumption and production'
- SDG13: 'Climate action'
- SDG14: 'Life below water'
- SDG15: 'Life on land'
- SDG16: 'Peace, justice and strong institutions'
- SDG17: 'Partnership for the goals'
As can be seen, the SDGs constitute a 'holistic framework' [2], whose implementation should be bottom-up, based on local governments' application of the goals and targets in their respective contexts [6]. While some SDGs directly concern local governments, such as SDG6 and SDG9 [19,21], clearly, regional and local governments have a key role in the achievement of many others because, in many countries, the competences for related services (e.g., health, education, social services, public transport, employment and water and waste management) are decentralized and these governments are primarily responsible for them [22,23].
Table 1 lists some examples of initiatives related to the achievement of the SDGs that fall under the competence of regional and local governments.
2.2. Theoretical framework
Several theories have been used in the literature to explain the adoption of sustainability practices and related disclosures by public and private organizations, including stakeholder theory and institutional theory, as well as legitimacy theory [22,24,25,26]. According to stakeholder theory, organizations must respond to the demands and needs of their main stakeholders [27]. In the case of local governments, their main stakeholders are the citizens to whom they must provide public services, and to whom they must be accountable for their actions [26,28]. From the perspective of institutional theory [29], the pressures from the environment in which an organization operates lead it to adopt certain behaviors and carry out certain practices and actions. In this sense, regions and municipalities differ in terms of their geographical, demographic and economic characteristics, which affect the main challenges they face in implementing public policies related to the 2030 Agenda [8].
Thus, according to these theoretical frameworks, both sociodemographic factors [26] and cultural factors [8] will influence the implementation of initiatives related to the achievement of the SDGs by regional and local governments, as well as the disclosure of information related to these initiatives and their outcomes to citizens and other stakeholders. The sociodemographic factors include the presence of certain population groups (e.g., dependent population, foreign population, elderly and unemployed), as well as the population density and geographical extension of the municipality, while the cultural factors refer to the sensitivity of citizens and other stakeholders to social and environmental issues. Moreover, the more inhabitants of a municipality, the greater the number and diversity of stakeholders it has to serve [30].
In addition to sociodemographic and cultural factors, the availability of resources (financial, technological and human) and the budgetary capacity of the municipality also determine its capability to implement policies related to the SDGs and to disclose information about them [8,24]. Thus, in the Spanish context, previous studies [24,30,31,32] have shown the influence of different sociodemographic and financial variables that influence positively the disclosure of social and environmental information by municipalities. Also, in the Norwegian context, Bardal et al. (2021) [8] have shown the influence of resource availability (financial, technological and human) and the cultural context on the implementation of the SDGs by Norwegian regional and local governments.
3.
Research design
3.1. Population and sample
Spain is a parliamentary monarchy organized in a multilevel system of government based on the principle of competence, which consists of three levels: the State, the Regions (17 autonomous communities and two autonomous cities) and the Municipalities (8,129 in total), each of which has financial and political autonomy to manage its responsibilities [19,31]. Figure 1 shows the geographical distribution of the Spanish territory and the extension of the different regions.
Table 2 shows some sociodemographic and financial data of the sampled municipalities.
Following previous studies [21,23], we used population as a criterion to select the sample under study, considering that large municipalities (i.e., those with more inhabitants) have to meet the needs of a larger number of citizens and have more resources to do so [24]; therefore, it is expected that they will have to deal with more complex economic and social issues than smaller entities, whose activity usually focuses on the provision of the most basic services. Based on the provisions of Law 57/2003, we have selected the 102 Spanish municipalities that meet the criteria to be considered large municipalities, i.e., those with a population of more than 75,000 inhabitants.
Given that both the geographical extension and the population of the different regions into which the Spanish territory is divided are very different, the distribution of the municipalities in the sample among the different regions is very diverse. Andalucía stands out, with 21 large municipalities, followed by Cataluña and Madrid, with 16 municipalities each. On the other hand, there are several regions with only one large municipality (e.g., Aragón, Cantabria, Ceuta, Islas Baleares, La Rioja, Melilla and Navarra).
The analysis period corresponds to six years (2016 to 2021), i.e., from the entry into force of the 2030 Agenda and to the last year for which complete data are available.
3.2. Variables
Based on previous studies [19], we identified 60 information items related to the different actions related to the implementation of the SDGs that may be developed by local entities (see Table 3). Each item is related to a specific SDG, with the exception of SDG9, SDG10, SDG12 and SDG16, which were not considered separately, due to their broad scope and to avoid duplication, as some of their targets are included in other SDGs to which they are related (e.g., SDG 11 and SDG 17). In addition, SDG13, SDG14 and SDG15 have been grouped together because of their relationship, and to favor the analysis of the Spanish territory on a homogeneous and comparable basis given the geographical diversity that characterizes the Spanish territory (coastal and inland regions) and the different challenges that arise in each case.
We carried out a content analysis of the different websites of the sampled entities using the following criterion: for each item and year with information present on the entities' website, a value of 1 was assigned, and 0 otherwise. This data collection technique allows the analysis of qualitative information through a quantitative analysis [33], and it has already been used in previous studies on local government transparency [34,35,36,37,38]. As a result, panel data of 612 observations were obtained.
Subsequently, the 60 information items were grouped into their corresponding SDGs, giving rise to 11 new quantitative variables, corresponding to SDG1, SDG2, SDG3, SDG4, SDG5, SDG6, SDG7, SDG8, SDG11, SDG13–15 and SDG17.
3.3. Method
The X-STATIS technique was used to reflect the multidimensional nature of our data. A similar approach has been used in previous studies related to both sustainability [19,39,40,41,42,43,44] and other fields, such as maritime safety [45] and Worldwide Governance Indicators [46]. This method, which belongs to the STATIS family [47,48] is used to analyze data with three-dimensional format structures, as in our case. Thus, the first dimension corresponds to the regions where the municipalities are located, the second dimension refers to the actions related to the implementation of the SDGs by the municipalities and the third dimension refers to the study period (2016–2021).
Applying the X-STATIS technique, our data form a table of (19 × 11) × 6 years: 19 regions (17 autonomous communities + 2 autonomous cities), 11 variables (the SDGs to which the information items refer) and the 6 years under study. The X-STATIS technique implies three levels of analysis: (i) inter-structure analysis, (ii) compromise (disclosure) analysis and (iii) infrastructure analysis, which was carried out by using the ADE-4 software [49].
Figure 2 depicts graphically the construction flow of the X-STATIS analyses.
4.
Results
4.1. Descriptive analysis
Table 4 shows the descriptive statistics. As can be seen, during the 6-year period studied, the level of commitment of municipalities to disclose information on the SDGs has been, on average, low, with a disclosure rate of 37.2%. However, disclosure on the SDGs has increased throughout the study period from 34.4% in 2016 to 43.1% in 2021.
This increase has also led to differences in the priorities of the municipalities. Thus, SDG8 and SDG11 are the top priorities of the municipalities, increasing the disclosure of information related to them by 35.7% and 27.9%, respectively, over the period; followed by SDG3, SDG4 and SDG13–15, with increases between 15% and 17%. These SDGs were also prioritized by municipalities in the last year studied (2021), with all of them showing a disclosure level above 40% (43.1%). Thus, SDG8 is disclosed by 92.9% of the municipalities, SDG11 by 61.8% of municipalities, SDG4 by 54.8% of municipalities, SDG13–15 by 51.4% of municipalities and SDG3 by 42.1% of municipalities.
In addition, the level of commitment to SDG1, SDG2 and SDG7 remained unchanged during the period, without significant variations. These SDGs are still not considered a priority by the municipalities, which report information on them in the range of 31–35% in 2021. On the other hand, SDG5, SDG6 and SDG17 experienced a decrease in their disclosure level, between 5–8%, presenting in 2021 a disclosure level of 31.2% (SDG 6) and 26.7% (SDG 5). SDG17 is the least prioritized goal by municipalities, with a disclosure level of 11.5% in 2021 and a decrease in disclosure of 9% over the study period.
Table 5 shows the descriptive statistics of the level of SDG disclosure for each autonomous community and the two autonomous cities. As can be seen, on average, all regions have increased their level of disclosure over the period of 2016–2021, with the exception of the autonomous cities of Ceuta and Melilla, where a decrease in the disclosure level of 14.6% and 7.2%, respectively, is observed, placing them at the lower pole with respect to the rest of the regions, with a disclosure level of less than 20% in 2021.
Regarding 2021, Cantabria is the region most committed to the 2030 Agenda, with the highest level of disclosure (65.3%), followed by Aragon (55.3%), La Rioja (54.9%), País Vasco (52.7%) and Navarra (52.2%), with Murcia and Comunidad Valenciana at similar levels (53–54%). In addition, these regions increased their disclosure levels by 15–24% during the period of study. The other regions (Castilla y León, Asturias, Castilla-La Mancha, Cataluña, Andalucía, Islas Baleares, Canarias, Extremadura and Galicia) show disclosure rates between 40–48% in 2021. At the opposite pole, Madrid shows a low disclosure rate (33%), and Ceuta and Melilla are below 20%.
4.2. Analysis by SDGs
As indicated above, the X-STATIS technique involves three levels of analysis. In regard to the inter-structure analysis, the similarities and differences between the years were analyzed through the vector correlation coefficient between matrices (Table 6).
In Figure 3, this information is plotted on a factorial plane, representing 76% of the information on the first two axes, by graphing the vector correlation analysis. The data show acute angles between the vectors, which implies that there are strong inter-annual relationships, which occur progressively. The largest difference between the years 2016 and 2021 stands out due to the growth mentioned above. Moreover, we can observe a turning point in 2019, which allows us to distinguish two distinct phases within the period: 2016–2019 and 2020–2021.
In order to deepen into the analysis of the years, in Figure 4 we show in two-dimensional form the disclosure level by SDG (vertical lines) and by year (horizontal lines) through a parallel coordinate graph. As can be seen, in the second phase (2020 and 2021), the priority SDGs are SDG8, SDG11, SDG4, SDG13–15 and SDG3, with a significant difference compared to the previous phase (2016–2019). In the remaining SDGs, the years are interspersed. As mentioned above, SDG17 is the most neglected by municipalities, with the lowest level of disclosure in 2021 (12%).
4.3. Analysis by region
Figure 5 shows the orientation toward the SDGs of each region through the commitment (disclosure) subspace. The 1–2 factorial plane contains 57% of the information, making it possible to observe individually how each region is positioned on the plane, so that each point summarizes its global disclosure level during the study period according to its preferences for the SDGs. This representation allows us to characterize the regions, identifying their priorities in relation to the SDGs and the challenges to be faced until 2030.
Looking at the direction of the vectors in Figure 5, we can see that most of the regions are on the right half-plane. Cantabria and País Vasco (located on the right of the map) stand out as the regions with the highest commitment to the SDGs, with greater emphasis on SDG3, SDG11, SDG4 and SDG5. Aragon has a similar profile, but with a lower level of commitment. In the lower part of the map, we find the rest of the SDGs, with Navarra and La Rioja being the regions with the greatest commitment to them, standing out in SDG7, SDG6, SDG13–15 and SDG2. Other regions, such as Murcia and the Comunidad Valenciana, also have this profile, with a lower commitment level. The rest of the regions are one or two levels below. Castilla y León and Asturias focus on SDG4 and SDG8, while the Islas Baleares and Extremadura focus on SDG13–15 and SDG7. Galicia, Islas Canarias and Madrid show the lowest levels of commitment, although they are above Ceuta and Melilla (located on the left of the map), which are the least committed to the 2030 Agenda.
The third part of the analysis corresponds to the infrastructure analysis (or trajectory analysis) which analyzes the evolution of the regions in each year. The factorial plane is the same as the previous one (Figure 5). Therefore, we know that it collects 57% of the information; the difference is that now we project the position of each region in the different years of the study. Previously, we have observed that all matrices (the years under study) have similar weights in the construction of the commitment (Table 7, column 'Weights') and have a correct representation in this subspace (Table 7, column 'Cos2').
This information is shown in Figure 6, where it is possible to individually observe each of the 19 regions and their position on the map for each year of the study so that we can evaluate their trajectory in this period. Each point reflects the position of the regions in terms of their preferences for the SDGs in each year, with the vectors corresponding to each SDG. Thus, in Figure 6, we can observe that many regions show dynamic trajectories, changing their preferences during the years of study.
Thus, Ceuta and Melilla, the lagging regions, show a negative evolution, moving their position to the left side of the map. Other regions, such as Castilla-La-Mancha, Cataluña, Galicia and Madrid, also lag in their position on the map, showing a low level of commitment to the SDGs located in that part of the map. The remaining regions show a stable or positive evolution in their commitment to the 2030 Agenda. Cantabria and País Vasco are the leading regions in the study throughout all the period, and their preferences change slightly, as shown by their vertical trajectories. Aragon shows a positive evolution over the years, which indicates that it is on the right way. La Rioja and Navarra, with a high disclosure level regarding to SDG7, SDG 6, SDG 2 and SDG 13–15, show strong changes in their priorities over the period, mainly in 2019 and 2020. A similar situation, although with a lower commitment, can be observed for Islas Baleares and Extremadura. Finally, we highlight a slight increase in the level of SDG disclosure for Castilla y León and Comunidad Valenciana.
4.4. Analysis by municipalities
Since our original data referred to the 102 largest Spanish municipalities, the X-STATIS analysis was performed on this data, which, in this case, is the 3-way matrix 102×11×6: 102 municipalities, 11 SDGs and 6 years (2016–2021). For reasons of visualization, for this analysis, we will only represent the commitment subspace, with the information synthesized from the study years in a single image (Figure 7). This representation reflects a total inertia of 53%, which makes it possible to identify which municipalities are the most advanced in the implementation of the 2030 Agenda and, on the contrary, which are the municipalities that are lagging the furthest behind, as well as which SDGs are more/less prioritized.
First, as can be seen in Figure 7, the structure of the variables is practically the same as that found in the previous analyses, which verifies the correlations mentioned above: on the one hand, SDG3, SDG4, SDG5, SDG8 and SDG11 are related (upper half-plane), and, on the other hand, SDG2, SDG6, SDG7, SDG13–15 and SDG17 are related (lower half-plane); however, in the previous analyses, SDG17 was not very discriminating and was located at the origin of the coordinates.
In relation to the 102 municipalities, it is worth noting that the city of Madrid presents one of the strongest commitments to the 2030 Agenda (with a disclosure level of 61% in 2021). This marks an important difference with respect to the analysis carried out previously by regions, in which the region of Madrid (with 16 municipalities in the sample) occupied one of the last positions. In general, we observe that a large majority of the municipalities are located in the middle of the figure, which translates into an unremarkable commitment to the 2030 Agenda.
The relevant information in this figure corresponds to the municipalities that distance themselves from the rest, which indicates a strong commitment to the 2030 Agenda, varying their priorities according to their proximity to one or another SDG. The most committed municipalities to the 2030 Agenda are located on the right half-plane. This is the case of A Coruña, Valencia, Barcelona, Donostia, Madrid, Santander, Valladolid, Vitoria-Gasteiz and Bilbao, all of which are large cities. These municipalities emphasize SDG3, SDG4, SDG5, SDG8 and SDG11. In second place, and only concerned with these SDGs, we find Getxo, Barakaldo and Las Palmas de Gran Canaria, smaller cities. If we move upward, we find Telde, Lugo, Avilés or Pontevedra, with deficient commitments, as they are only concerned with two or three SDGs, i.e., SDG4 and SDG8.
5.
Discussion
From the analysis carried out on the commitment of Spanish regions to the 2030 Agenda, as measured by the disclosure of information on municipal websites on various initiatives developed to achieve the SDGs between 2016 and 2021, it is possible to state that the disclosure rate is quite low, with an average of 37.2%. This rate is much lower than that obtained by Alcaraz-Quiles et al. (2014, 2017) [22,50], who found a disclosure rate of 61.23% in Spanish regions in relation to the information items proposed in the guidelines issued by the Global Reporting Initiative. However, it should be noted that these authors analyzed the disclosure regarding a list of items related to general information, financial information, social information and environmental information, while we only analyzed the disclosure of information related to initiatives directly linked to the achievement of the SDGs. Our result is also slightly lower than the disclosure rate obtained by Navarro et al. [30], who analyzed the disclosure of information on corporate social responsibility on the websites of 55 large Spanish local governments, finding a disclosure rate of 40.42%. More recently, Navarro-Galera et al. [51], in an international comparative analysis including large municipalities from nine European countries, found that the disclosure of sustainability information by the 19 large Spanish municipalities included in their sample was 48%, which is lower than that of municipalities from Anglo-Saxon and Nordic countries.
Nevertheless, it is worth noting that disclosure on the SDGs has increased throughout the study period, from 34.4% in 2016 to 43.1% in 2021. This positive evolution seems to indicate a growing involvement of municipalities in the 2030 Agenda and a greater transparency of information in this regard. In addition, we can observe a turning point in 2019, which allows us to distinguish two different stages within the study period: 2016–2019 and 2020–2021. This difference can be explained by the paradigm shift brought about by the COVID-19 epidemic in the way governments, especially local governments, deliver public services to citizens and prioritize actions within government agendas [52,53], as well as in the disclosure of information through their digital channels [54,55].
Both the SDG disclosure level and its evolution over the study period vary significantly between municipalities and regions, as well as by SDG. SDG8 and SDG11 stand out as the municipalities' top priorities, increasing the disclosure of information related to them; SDG3 and SDG4 and SDG13–15 also show a high degree of commitment, while, for SDG5, SDG6 and SDG17, there is a low level of disclosure, which also decreased during the period. In this respect, our results differ from those obtained by the Fondazione Eni Enrico Mattei (2020) [56], which, in the case of Italy, documents the best results at the local level for SDG1, SDG6 and SDG17. It seems that Spanish municipalities focus mainly on the SDGs related to the Planet and People pillars of the 2030 Agenda, while, on the contrary, the Partnership pillar (SDG 17) has received less attention, despite the importance of partnerships in solving the problems related to the lack of financial and human resources for the implementation of the SDGs at the local level [57]. On the other hand, from the perspective of the three dimensions of sustainability (i.e., social, environmental and governance), Spanish municipalities seem to give more importance to the social dimension of sustainability, followed by the environmental dimension, while governance comes in last place. This result may be explained by the fact that governance is "a highly contextual concept, in which processes and practices vary significantly depending on the environment in which they are applied, " which, in this case, involves the size and political and financial constraints of the municipalities [58].
In regard to the regions, Cantabria and País Vasco stand out as the Spanish regions most committed to the SDGs, followed by Aragon, La Rioja and Navarra. Conversely, Galicia, Islas Canarias and Madrid show the lowest commitment levels, along with the autonomous cities of Ceuta and Melilla, the lagging regions, which also show a negative evolution. Our ranking of regions according to their commitment to the SDGs differs significantly from that obtained by Alcaraz-Quiles et al. [50] regarding the transparency of sustainability information. Following D'Adamo et al. [16], we have grouped the regions into three clusters according to their level of SDG disclosure. We started from the average mean value (37.2%) and considered that the regions with mean values around this value (± 11 %, the average standard deviation) form the cluster of SDG medium values, whereas those regions with mean values higher and lower form the cluster of SDG high values and the cluster of SDG low values, respectively. Thus, the cluster of high SDG values is made up of five regions: Cantabria (53.4%), País Vasco (48.8%), Comunidad Valenciana (44.4%), Navarra (42.6%) and Aragón (41.8%); and, the cluster of SDG low values is made up of three regions: Melilla (17.9%), Ceuta (24.5%) and Madrid (28.5%). The remaining regions are included in the cluster of medium SDG values. To a certain extent, our results suggest a relationship between the geographical localization of regions and their level of commitment to the SDGs. As can be seen in Figure 1, the Spanish regions most committed to the SDGs are located in the northeastern quadrant of the Iberian Peninsula, in the so-called Ebro Valley, while the lagging regions (Ceuta and Melilla) are located in North Africa. In this sense, our findings seem to confirm the influence of the geographical localization of regions and municipalities on their SDG performance documented in the case of Italy by D'Adamo and Gastaldi [17] and D'Adamo et al. [16].
With regard to municipalities, the city of Madrid shows one of the strongest commitments to the 2030 Agenda. In addition to the city of Madrid, the most committed municipalities to the 2030 Agenda are A Coruña, Valencia, Barcelona, Donostia, Santander, Valladolid, Vitoria-Gasteiz and Bilbao, all of which are large cities, whereas the last positions correspond to Telde, Lugo, Avilés or Pontevedra, i.e., smaller cities that are only concerned with two or three SDGs. In this sense, the size of the municipality seems to positively affect the degree of commitment of local governments to the 2030 Agenda and the disclosure of information on initiatives related to the SDGs. This positive effect would be consistent with the findings obtained by Guillamón et al. [31] and García-Sánchez et al. [24], who found a significant positive relationship between the size of a municipality (measured by its population) and the level of disclosure of sustainability information. However, this contrasts with the findings of Navarro et al. and Alcaraz-Quiles et al. [30,50], who did not find a significant association. Similarly, Akande et al. [15] found no statistical relationship between the position of municipalities in the ranking of smart and sustainable European cities and their population.
In addition to the size of the municipalities, the influence of several sociodemographic factors can also explain both the priorities of the regions and municipalities in relation to the SDGs and their level of commitment to the 2030 Agenda. First is the percentage of the dependent population. From the standpoint of the overarching goal of 'leave no one behind' that characterizes the 2030 Agenda, the needs of the dependent population pose a number of challenges for municipalities, which, from the perspective of stakeholder theory, could explain a greater commitment to the SDGs and more transparency on sustainability [30,36]. This would explain why Cantabria and País Vasco, with an average level of dependent population of 60%, and Aragón, Navarra and La Rioja, with 57–58%, show a greater preference for those SDGs that are more related to people (SDG3, SDG4 and SDG5).
Second, population density affects the strength of stakeholder pressure [26], as the demand for public services and resources tends to be higher in more densely populated regions and municipalities [59]. In this respect, Alcaraz-Quiles et al. [36,50] found that those Spanish regions with a higher population density had higher levels of sustainability information disclosure. However, although, in our case, some of the regions most committed to the SDGs are just those with the highest population densities (e.g., Cantabria, País Vasco and Navarra), Melilla, the region with the second highest population density, shows the lowest level of commitment to the 2030 Agenda. The same applies to other factors, such as foreign population and unemployment rate, which, according to previous studies, have been shown to affect municipalities' commitment to sustainability and information transparency. Regarding population density, our results are in line with those obtained by D'Adamo et al. [16], who also found no relationship between the Italian cities' population densities and their performance in relation to the SDGs.
6.
Concluding remarks
Given the important role that local governments play in global development and the achievement of the 2030 Agenda [9], in this study, we have analyzed the current state of commitment to the 2030 Agenda at the regional and local levels, as measured by the information on SDG-related initiatives disclosed by local governments through their websites. On this basis, we have analyzed the dynamic evolution by SDG, year and region, in order to identify the main priorities of their government agendas and the challenges to achieve the commitments of this global agenda by 2030.
The results show a low commitment of the Spanish municipalities to the SDGs (37.2% on average), although it increases significantly over the period, with differences in the priorities of the municipalities in terms of their emphasis on the different SDGs and their evolution over time. SDG8 and SDG11 stand out as the main priorities of the municipalities, while initiatives related to SDG5, SDG6 and SDG 17 are the least prioritized. The COVID-19 pandemic has marked a turning point in this regard, with greater importance being given to the SDGs that are more related to people and prosperity.
Our findings help citizens and public authorities to understand the degree of sustainability of regions and municipalities, assess their performance in relation to different dimensions of sustainability and identify the main challenges for future improvements. Specifically, by highlighting differences in the degree of commitment of Spanish municipalities and regions to the 2030 Agenda, our findings can guide policymakers in the design of policies aimed at improving SDG performance in those municipalities and regions with the lowest commitment levels, as well as show which SDGs should be emphasized by public policies. In particular, Spanish municipalities should improve their performance in relation to actions related to gender equality, clean water and sanitation, and partnerships, and the national government should favor investment in lagging regions and municipalities in order to improve their level of commitment to the SDGs and reduce inequalities. From an academic perspective, our findings provide support for the usefulness of stakeholder theory and institutional theory as a theoretical basis for explaining the commitment of municipalities and regions to the 2030 Agenda. The existence of differences in the degree of commitment of municipalities and regions to the 2030 Agenda, which, in our opinion, can be explained by differences in both sociodemographic and cultural characteristics, opens a way for the analysis of possible trajectories in the implementation of the SDGs at regional and local levels and the study of their determinants.
This research is not without limitations, mainly related to the sample. The sample is focused on a single country (Spain) and includes only the largest municipalities. Future studies could extend the scope of the analysis to other countries and include a larger number of municipalities. Future studies could also use econometric models to analyze the influence of the sociodemographic factors mentioned in this paper on the degree of commitment of municipalities to the SDGs. Additionally, this study could be replicated using other quantitative methods, such as multi-criteria decision analysis (MCDA). This method, which is widely used in healthcare decision-making and the evaluation of policy options, could be used to rank municipalities and regions according to their performance in terms of the SDGs and compare the results with those of this study. In this respect, MCDA has been used to compare performance in relation to the SDGs in the case of Italian cities [16,17], as well as across European countries [18].
Acknowledgments
Xunta de Galicia [Grant/Award Number: 2020 GPC GI-2016].
Conflict of interest
All authors declare no conflict of interest regarding the publication of this paper.