Around 333BC, Diogenes Laertius cited (Greek quote): "οὐκ ἐν τῷ μεγάλῳ τὸ εὖ…, ἀλλ᾿ ἐν τῷ εὖ τὸ μέγα", which means that volume (big data: tera, peta, velocity and variety) doesn't guarantee quality. Furthermore, Protagoras's doctrine about homo mensura and the Socratic Maieutic method evidences demonstrated the way that queries (SQL) on big data can play on specific needs when crafted, such as turning big data into knowledge and a competitive advantage. In this research, an alternative to the data-driven approach will be propounded with the development of the strategic alignment model (SAM) based on the principles of Greek philosophy. The SAM model will support decisions of big data analytics structure with strategies to fit and align in a way to create a competitive advantage. Mathematical formulation of the model will help to optimize a competitive advantage through the economic value added (EVA) to guide the proper strategy and big data analytics structure in a holistic framework. Conclusions will be drawn on how strategy and the structure of big data analytics can be aligned.
Citation: Petros Theodorou, Theodoros Theodorou. Valuation of big data analytics quality and competitive advantage with strategic alignment model: from Greek philosophy to contemporary conceptualization[J]. Data Science in Finance and Economics, 2024, 4(1): 53-64. doi: 10.3934/DSFE.2024002
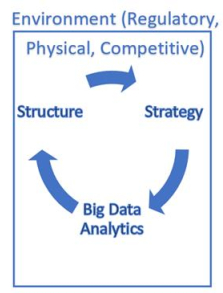
Around 333BC, Diogenes Laertius cited (Greek quote): "οὐκ ἐν τῷ μεγάλῳ τὸ εὖ…, ἀλλ᾿ ἐν τῷ εὖ τὸ μέγα", which means that volume (big data: tera, peta, velocity and variety) doesn't guarantee quality. Furthermore, Protagoras's doctrine about homo mensura and the Socratic Maieutic method evidences demonstrated the way that queries (SQL) on big data can play on specific needs when crafted, such as turning big data into knowledge and a competitive advantage. In this research, an alternative to the data-driven approach will be propounded with the development of the strategic alignment model (SAM) based on the principles of Greek philosophy. The SAM model will support decisions of big data analytics structure with strategies to fit and align in a way to create a competitive advantage. Mathematical formulation of the model will help to optimize a competitive advantage through the economic value added (EVA) to guide the proper strategy and big data analytics structure in a holistic framework. Conclusions will be drawn on how strategy and the structure of big data analytics can be aligned.

| [1] | Akter S, Wamba SF, Gunasekaran A, et al. (2016) How to improve firms performance using big data analytics capability and business strategy alignment. Int J product Econ 182: 113. |
| [2] |
Akter S, Wamba SF, Gunasekaran A, et al. (2016) How to improve firm performance using big data analytics capability and business strategy alignment? Int J Product Econ 182: 113–131. https://doi.org/10.1016/j.ijpe.2016.08.018 doi: 10.1016/j.ijpe.2016.08.018

|
| [3] |
Arshad Zulgarnain M, Arshad D, Lamsali H, et al. (2023) Strategic resources alignment for sustainability: The impact of innovation capability and intellectual capital on SME's performance. Moderating role of external environment. J Clean Product 417: 137884. https://doi.org/10.1016/j.jclepro.2023.137884 doi: 10.1016/j.jclepro.2023.137884
|
| [4] | Bartik D (2014) How Data Analytics and the Socratic Method Can Help Take Your Business to the Next Level, Dell Technologies, Company Updates. |
| [5] | Benkler Y (2002) Coase's Penguin or Linux and the nature of the firm 112 YALE L.J. 369. |
| [6] | Bergeron F, Raymond L, Rivard S (2001) Fit in strategic information technology management research: an empirical comparison of perspectives. Omega 29: 125. |
| [7] |
Chen L, Liu H, Zhou Z, et al. (2022) IT-business alignment, big data analytics capability, and strategic decision-making: Moderating roles of event criticality and disruption of COVID-19. Decis Support Syst 161: 113745. https://doi.org/10.1016/j.dss.2022.113745 doi: 10.1016/j.dss.2022.113745
|
| [8] | Grover V, Chiang RHL, Liang TP, et al. (2018) Creating Strategic business Value from big data analytics: A research framework. J Manag Inf Syst 35: 388. |
| [9] | Gupta M, George JF (2016) Toward the development of big data analytics capability. Inf Manage 53: 1049. |
| [10] |
Karlsson Stefan, Orgazi P, Hellstrom D, et al. (2023) Retail returns management strategy: An alignment perspective. J Innovation Knowl 8: 100420. https://doi.org/10.1016/j.jik.2023.100420. doi: 10.1016/j.jik.2023.100420
|
| [11] |
Lei Fong C, Ngai EWT, Lo CWH, et al., (2023) Green IT/IS adoption and environmental performance: The synergistic roles of IT–business strategic alignment and environmental motivation. Inform Manage 60: 103886. https://doi.org/10.1016/j.im.2023.103886. doi: 10.1016/j.im.2023.103886
|
| [12] | Manthou V, Vlachopoulou M, Theodorou P (1996) The Implementation and Use of Material Requirement Planning System in Northern Greece: A Case Study. Int J Prod Econ 45: 187. |
| [13] |
Martinsuo M, Antilla R (2022) Practices of strategic alignment in and between innovation project portfolios. Proj Leadership Soc 3: 100066. https://doi.org/10.1016/j.plas.2022.100066. doi: 10.1016/j.plas.2022.100066
|
| [14] | McAfee A, Brynjolfsson E, Davenport TH, et al., (2012) Big Data: the management revolution. HBR 90: 60. |
| [15] | McKinsey (2016) The Age of Analytics: Competing in a Data Driven World. McKinsey Global Institute Research. |
| [16] | Miles RE, Snow CC (1984) Fit Failure and the Hall of Fame. California Manage Rev 26: 10–28 |
| [17] | Mintzberg H, Quinn JB (1996) The Strategy Process, Englewood Cliffs, NJ: Prentice Hall. |
| [18] | Morton SM (1991) The Corporation of the '90s Information Technology and Organizational transformation. Oxford. |
| [19] | Neuman S (1994) Strategic information systems, competition through information technologies. NY:McMillan. |
| [20] |
Ngo Quang-Huy (2023) The effectiveness of strategic alignment between open innovation and generic strategies: Empirical evidence from restaurant SMEs in Vietnam. JOItmC 9: 100016. https://doi.org/10.1016/j.joitmc.2023.100016 doi: 10.1016/j.joitmc.2023.100016
|
| [21] |
Pashutan Masume, Abdolvand N, Harandi SR (2022) The impact of IT resources and strategic alignment on organizational performance: The moderating role of environmental uncertainty. Digit Bus 2: 100026. https://doi.org/10.1016/j.digbus.2022.100026 doi: 10.1016/j.digbus.2022.100026
|
| [22] |
Pelletier C, Raymond L (2023) Investigating the strategic IT alignment process with a dynamic capabilities view: A multiple case study. Inform Manage 103819. https://doi.org/10.1016/j.im.2023.103819 doi: 10.1016/j.im.2023.103819
|
| [23] |
Pesce D, Neirotti P (2023) The Impact of IT-Business Strategic Alignment on Firm Performance: The Evolving role of IT in Industries. Inform Manage 60: 103800. https://doi.org/10.1016/j.im.2023.103800 doi: 10.1016/j.im.2023.103800
|
| [24] | Porter M (1979) How competitive forces shape strategy, HBR March-April. |
| [25] | Porter M (1987) From competitive advantage to corporate strategy. HBR. |
| [26] |
Primasari Clara H (2022) Strategy for achieving IT-business alignment in gaming industry in Indonesia. Procedia Comput Sci 197: 469–476. https://doi.org/10.1016/j.procs.2021.12.163 doi: 10.1016/j.procs.2021.12.163
|
| [27] | Shdifat B, Centindamar D, Erfani S (2019) A Literature review on Big Data Analytics Capabilities, 2019 Proceedings of PICMET '19. Technology Management in the World of Intelligent Systems. https://doi.org/10.23919/PICMET.2019.8893673 |
| [28] | Smith SD, Thomas Tyler F (2023) The effects of strategic alignment and strategic clarity on multidimensional task performance. Account Org Soc 101524. https://doi.org/10.1016/j.aos.2023.101524 |
| [29] | Theodorou P (2003) Strategic Information Systems: The Concept of Alignment, in IT-Based Management and challenges and Solutions, Luiz Antonio Joia, IDEA group publishing. |
| [30] | Theodorou P (2005) Business Strategy, Structure and IT Alignment, Encyclopedia of Information Science and Technology, 1st Edition, Mehdi Khosrow-Pour, 356. https://doi.org/10.4018/978-1-59140-553-5 |
| [31] | Theodorou P, Dranidis D (2001) Structural design fit performance in garment production: a neural network approach, ORSA, 2nd European Conference on Inteligent management systems in operations, Khairy Kobbacy and Sunil Vadera, University of Salford. |
| [32] | Theodorou P, Karyampas D (2007) Computational Intelligence in the Financial Functions of Industrial Firms, in Handbook of Computational Intelligence in Manufacturing and Production Management, Dipak Laha & Purnendu Mandal, Information Science Reference pub. Look in figure 1. |
| [33] | Theodorou P (1996) Restructuring of Production: The Flexibility Strategy, in Management of SME's, Siskos, Zoupounidis, Pappis, Crete University Press. |
| [34] | Theodorou P (1996a) Flexible Manufacturing and the IT Applications: the manufacturing strategies map. 2nd Alps Euroconference, Bologna. |
| [35] | Theodorou P (2000) Structural design fit in garment production: a neural network approach. Proceedings of the 2nd European conference on intelligence management systems in operations. Operational Research Society, University of Salford. |
| [36] | Theodorou P, Florou G (2008) Manufacturing Strategies and Financial Performance-The effect of advanced information technology: CAD/CAM systems. Omega 36: 107. |
| [37] | Vlachopoulou M, Manthou V, Theodorou P (1994) The Application of CAD Systems in Greek Garment Industry, 4th International Congress New Technologies in Business and Economics, Thessaloniki, University Studio Press, Economic Society of Thessaloniki. |
| [38] | Wamba SF, Akter S, Edwards A, et al. (2015) How 'big data' can make a big impact: findings from a systematic review and a longitudinal case study. Int J Prod Econ 46: 165. |
| [39] |
Wang G, Gunasekaran A, Ngai EWT, et al. (2016) Big Data analytics in logistics and supply chain management: certain investigations for research and applications. Int J prod Econ 176: 98. https://doi.org/10.1016/j.ijpe.2016.03.014 doi: 10.1016/j.ijpe.2016.03.014
|
| [40] |
Wang Tao, Deng CP, Teo TSH (2023) Appropriating IT outsourcing for IT alignment: An adaptive structuration theory perspective. Technol Forecast Soc 192: 122581. https://doi.org/10.1016/j.techfore.2023.122581 doi: 10.1016/j.techfore.2023.122581
|
| [41] | Wiseman C (1998) Strategic information systems. Homewood, IL: Irwin. |
Figures(1)
Petros Theodorou, Theodoros Theodorou. Valuation of big data analytics quality and competitive advantage with strategic alignment model: from Greek philosophy to contemporary conceptualization[J]. Data Science in Finance and Economics, 2024, 4(1): 53-64. doi: 10.3934/DSFE.2024002


 DownLoad: