A vast amount of literature has been conducted for investigating the association of different lunar phases with human health; and it has mixed reviews for association and non-association of diseases with lunar phases. This study investigates the existence of any impact of moon phases on humans by exploring the difference in the rate of outpatient visits and type of diseases that prevail in either non-moon or moon phases.
We retrieved dates of non-moon and moon phases for eight years (1st January 2001–31st December 2008) from the timeanddate.com website for Taiwan. The study cohort consisted of 1 million people from Taiwan's National Health Insurance Research Database (NHIRD) followed over eight years (1st January 2001–31st December 2008). We used the two-tailed, paired-t-test to compare the significance of difference among outpatient visits for 1229 moon phase days and 1074 non-moon phase days by using International Classification of Diseases, Ninth Revision, Clinical Modification (ICD-9-CM) codes from NHIRD records.
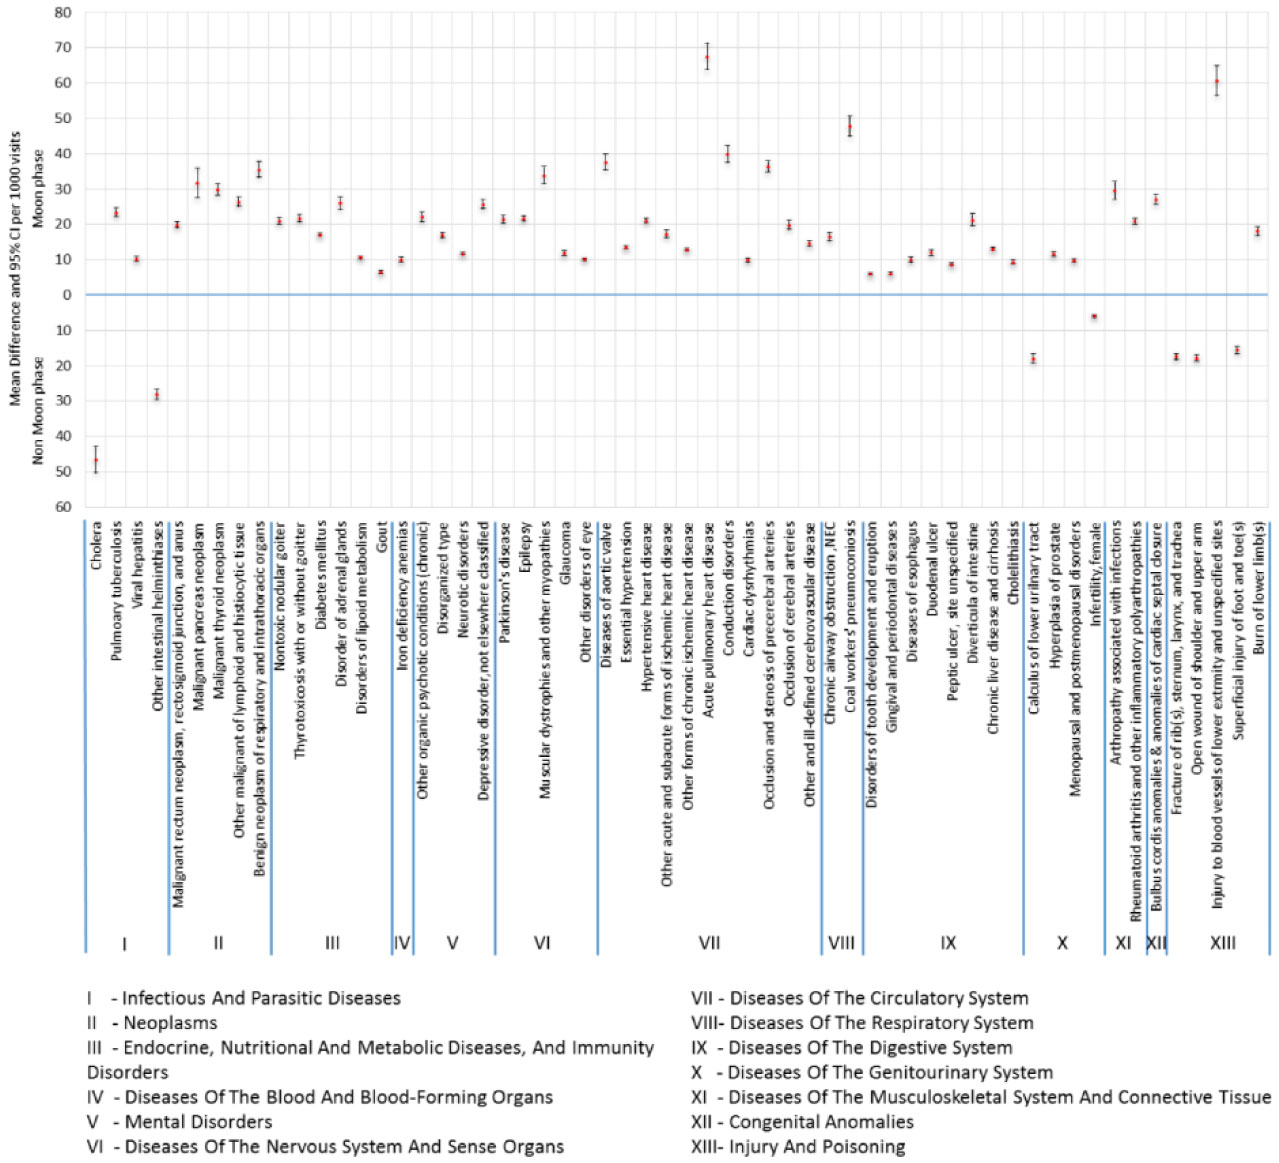
We found 58 diseases that showed statistical differences in number of outpatient visits in the non-moon and moon phases.
The results of our study identified diseases that have significant variations during different lunar phases (non-moon and moon phases) for outpatient visits in the hospital. In order to fully understand the reality of the pervasive myth of lunar effects on human health, behaviors and diseases, more in-depth research investigations are required for providing comprehensive evidence covering all the factors, such as biological, psychological and environmental aspects.
Citation: Mohy Uddin, Aldilas Achmad Nursetyo, Usman Iqbal, Phung-Anh Nguyen, Wen-Shan Jian, Yu-Chuan Li, Shabbir Syed-Abdul. Assessment of effects of moon phases on hospital outpatient visits: An observational national study[J]. AIMS Public Health, 2023, 10(2): 324-332. doi: 10.3934/publichealth.2023024
A vast amount of literature has been conducted for investigating the association of different lunar phases with human health; and it has mixed reviews for association and non-association of diseases with lunar phases. This study investigates the existence of any impact of moon phases on humans by exploring the difference in the rate of outpatient visits and type of diseases that prevail in either non-moon or moon phases.
We retrieved dates of non-moon and moon phases for eight years (1st January 2001–31st December 2008) from the timeanddate.com website for Taiwan. The study cohort consisted of 1 million people from Taiwan's National Health Insurance Research Database (NHIRD) followed over eight years (1st January 2001–31st December 2008). We used the two-tailed, paired-t-test to compare the significance of difference among outpatient visits for 1229 moon phase days and 1074 non-moon phase days by using International Classification of Diseases, Ninth Revision, Clinical Modification (ICD-9-CM) codes from NHIRD records.
We found 58 diseases that showed statistical differences in number of outpatient visits in the non-moon and moon phases.
The results of our study identified diseases that have significant variations during different lunar phases (non-moon and moon phases) for outpatient visits in the hospital. In order to fully understand the reality of the pervasive myth of lunar effects on human health, behaviors and diseases, more in-depth research investigations are required for providing comprehensive evidence covering all the factors, such as biological, psychological and environmental aspects.

| [1] |
Chakraborty U, Ghosh T (2013) A study on the physical fitness index, heart rate and blood pressure in different phases of lunar month on male human subjects. Int J Biometeorol 57: 769-774. https://doi.org/10.1007/s00484-012-0605-z 
|
| [2] |
Ahmad F, Quinn TJ, Dawson J, et al. (2008) A link between lunar phase and medically unexplained stroke symptoms: an unearthly influence?. J Psychosom Res 65: 131-133. https://doi.org/10.1016/j.jpsychores.2008.05.011
|
| [3] |
Boland MR, Shahn Z, Madigan D, et al. (2015) Birth month affects lifetime disease risk: a phenome-wide method. J Am Med Inform Assn 22: 1042-1053. https://doi.org/10.1093/jamia/ocv046
|
| [4] |
Disanto G, Chaplin G, Morahan JM, et al. (2012) Month of birth, vitamin D and risk of immune-mediated disease: a case control study. BMC Medicine 10: 69. https://doi.org/10.1186/1741-7015-10-69
|
| [5] |
Doblhammer G, Vaupel JW (2001) Lifespan depends on month of birth. P Natl Acad Sci Usa 98: 2934-2939. https://doi.org/10.1073/pnas.041431898
|
| [6] |
Halldner L, Tillander A, Lundholm C, et al. (2014) Relative immaturity and ADHD: findings from nationwide registers, parent- and self-reports. J Child Psychol Psyc 55: 897-904. https://doi.org/10.1111/jcpp.12229
|
| [7] |
Huber S, Didham R, Fieder M (2008) Month of birth and offspring count of women: data from the Southern hemisphere. Hum Reprod 23: 1187-1192. https://doi.org/10.1093/humrep/den079
|
| [8] |
Huber S, Fieder M (2011) Perinatal winter conditions affect later reproductive performance in Romanian women: intra and intergenerational effects. Am J Hum Biol 23: 546-552. https://doi.org/10.1002/ajhb.21184
|
| [9] |
Kahn HS, Morgan TM, Case LD, et al. (2009) Association of type 1 diabetes with month of birth among U.S. youth: The SEARCH for Diabetes in Youth Study. Diabetes Care 32: 2010-2015. https://doi.org/10.2337/dc09-0891
|
| [10] |
Kemkes A (2010) The impact of maternal birth month on reproductive performance: controlling for socio-demographic confounders. J Biosoc Sci 42: 177-194. https://doi.org/10.1017/S002193200999054X
|
| [11] |
McGrath JJ, Eyles DW, Pedersen CB, et al. (2010) Neonatal vitamin D status and risk of schizophrenia: a population-based case-control study. Arch Gen Psychiat 67: 889-894. https://doi.org/10.1001/archgenpsychiatry.2010.110
|
| [12] |
Willer CJ, Dyment DA, Sadovnick AD, et al. (2005) Timing of birth and risk of multiple sclerosis: population based study. Brit Med J 330: 120. https://doi.org/10.1136/bmj.38301.686030.63
|
| [13] |
Ali Y, Rahme R, Matar N, et al. (2008) Impact of the lunar cycle on the incidence of intracranial aneurysm rupture: myth or reality?. Clin Neurol Neurosur 110: 462-465. https://doi.org/10.1016/j.clineuro.2008.02.001
|
| [14] |
Baxendale S, Fisher J (2008) Moonstruck? The effect of the lunar cycle on seizures. Epilepsy Behav 13: 549-550. https://doi.org/10.1016/j.yebeh.2008.06.009
|
| [15] |
Cameron PA, Mitra B, Fitzgerald M, et al. (2009) Black Saturday: the immediate impact of the February 2009 bushfires in Victoria, Australia. Med J Australia 191: 11-16. https://doi.org/10.5694/j.1326-5377.2009.tb02666.x
|
| [16] |
Chakraborty U (2014) Effects of different phases of the lunar month on humans. Biol Rhythm Res 45: 383-396. https://doi.org/10.1080/09291016.2013.830508
|
| [17] |
Camacho FP, Lanzagorta N, Ovando IC, et al. (2003) Lunar and Seasonal Rhythms and Childhood Mortality. Biol Rhythm Res 34: 475-484. https://doi.org/10.1076/brhm.34.5.475.27848
|
| [18] |
Mao Y, Schnytzer Y, Busija L, et al. (2015) “MOONSTROKE”: Lunar patterns of stroke occurrence combined with circadian and seasonal rhythmicity--A hospital based study. Chronobiol Int 32: 881-888. https://doi.org/10.3109/07420528.2015.1049614
|
| [19] |
Duvdevani SI, Migirov L, Wolf M, et al. (2014) The rate of spontaneous epistaxis is not linked to the lunar cycle but shows seasonal variations. Chronobiol Int 31: 851-854. https://doi.org/10.3109/07420528.2014.916298
|
| [20] |
Kamp MA, Dibue M, Slotty P, et al. (2013) Impact of the moon on cerebral aneurysm rupture. Acta Neurochir 155: 1525-1530. https://doi.org/10.1007/s00701-013-1740-y
|
| [21] |
Kanth R, Berg RL, Rezkalla SH (2012) Impact of lunar phase on the incidence of cardiac events. World J Cardiovas Dis 2: 124-128. https://doi.org/10.4236/wjcd.2012.23020
|
| [22] |
Komann M, Weinmann C, Meissner W (2014) Howling at the moon? The effect of lunar phases on post-surgical pain outcome. Brit J Pain 8: 72-77. https://doi.org/10.1177/2049463714522985
|
| [23] |
Lahner D, Marhold F, Gruber A, et al. (2009) Impact of the lunar cycle on the incidence of aneurysmal subarachnoid haemorrhage: myth or reality?. Clin Neurol Neurosur 111: 352-353. https://doi.org/10.1016/j.clineuro.2008.11.009
|
| [24] |
Terra-Bustamante VC, Scorza CA, de Albuquerque M, et al. (2009) Does the lunar phase have an effect on sudden unexpected death in epilepsy?. Epilepsy Behav 14: 404-406. https://doi.org/10.1016/j.yebeh.2008.11.013
|
| [25] |
Martens R, Kelly IW, Saklofske DH (1988) Lunar phase and birthrate: a 50-year critical review. Psychol Rep 63: 923-934. https://doi.org/10.2466/pr0.1988.63.3.923
|
| [26] |
Foster RG, Roenneberg T (2008) Human responses to the geophysical daily, annual and lunar cycles. Curr Biol 18: R784-R794. https://doi.org/10.1016/j.cub.2008.07.003
|
| [27] |
Rotton J, Kelly IW (1985) Much ado about the full moon: a meta-analysis of lunar-lunacy research. Psychol Bull 97: 286-306. https://doi.org/10.1037/0033-2909.97.2.286
|
| [28] |
Benbadis SR, Chang S, Hunter J, et al. (2004) The influence of the full moon on seizure frequency: myth or reality?. Epilepsy Behav 5: 596-597. https://doi.org/10.1016/j.yebeh.2004.04.001
|
| [29] |
Martínez García MA, Galiano Blancart R, Cabero Salt L, et al. (2004) Prevalence of Sleep-Disordered Breathing in Patients With Acute Ischemic Stroke: Influence of Onset Time of Stroke. Arch Bronconeumol 40: 196-202. https://doi.org/10.1016/S1579-2129(06)70084-2
|
| [30] |
Wende R, von Klot S, Kirchberger I, et al. (2013) The influence of lunar phases on the occurrence of myocardial infarction: fact or myth? The MONICA/KORA Myocardial Infarction Registry. Eur J Prev Cardiol 20: 268-274. https://doi.org/10.1177/2047487312438193
|
| [31] | ICD9DataThe Web's Free ICD-9-CM Medical Coding Reference (2019). |
| [32] | Umuhire D (2019) Pharmacy and health insurance databases. RWE Navigator . |
| [33] |
Chen YC, Yeh HY, Wu JC, et al. (2010) Taiwan's National Health Insurance Research Database: administrative health care database as study object in bibliometrics. Scientometrics 86: 365-380. https://doi.org/10.1007/s11192-010-0289-2
|
| [34] |
Kazemi-Bajestani SM, Amirsadri A, Samari SA, et al. (2011) Lunar phase cycle and psychiatric hospital emergency visits, inpatient admissions and aggressive behavior. Asian J Psychiatr 4: 45-50. https://doi.org/10.1016/j.ajp.2010.12.002
|
| [35] |
Meyer-Rochow VB, Hakko T, Hakko H, et al. (2021) Synodic lunar phases and suicide: based on 2605 suicides over 23 years, a full moon peak is apparent in premenopausal women from northern Finland. Mol Psychiatry 26: 5071-5078. https://doi.org/10.1038/s41380-020-0768-7
|
| [36] |
Alhumoud A, Alhemoud H (2013) Lunar cycle effect on patient visit to psychiatry hospital emergency room: studying the ‘Transylvanian effect’ in an Islamic society. Int J of Cult Ment Heal 7: 216-223. https://doi.org/10.1080/17542863.2013.771690
|
| [37] |
Yang AW, Johnson JD, Fronczak CM, et al. (2016) Lunar Phases and Emergency Department Visits for Renal Colic Due to Ureteral Calculus. PLoS One 11: e0157589. https://doi.org/10.1371/journal.pone.0157589
|
| [38] |
Roman EM, Soriano G, Fuentes M, et al. (2004) The influence of the full moon on the number of admissions related to gastrointestinal bleeding. Int J Nurs Pract 10: 292-296. https://doi.org/10.1111/j.1440-172x.2004.00492.x
|
| [39] | Sitar J (1989) The effect of solar activity on lunar changes in cardiovascular mortality. Casopis Lékaru Ceských 128: 425-428. |
| [40] | Zimecki M (2009) The lunar cycle: effects on human and animal behavior and physiology. Postep Hig Med Dosw 60: 1-7. |
Figures(1) / Tables(1)

Mohy Uddin, Aldilas Achmad Nursetyo, Usman Iqbal, Phung-Anh Nguyen, Wen-Shan Jian, Yu-Chuan Li, Shabbir Syed-Abdul. Assessment of effects of moon phases on hospital outpatient visits: An observational national study[J]. AIMS Public Health, 2023, 10(2): 324-332. doi: 10.3934/publichealth.2023024


 DownLoad: