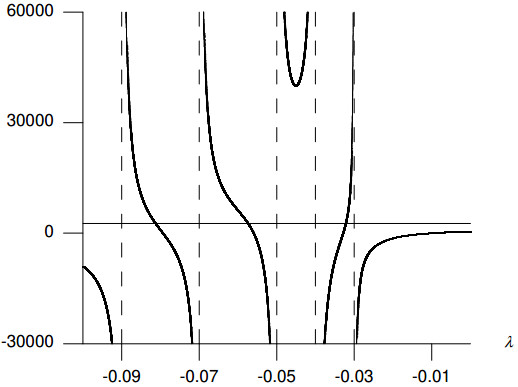
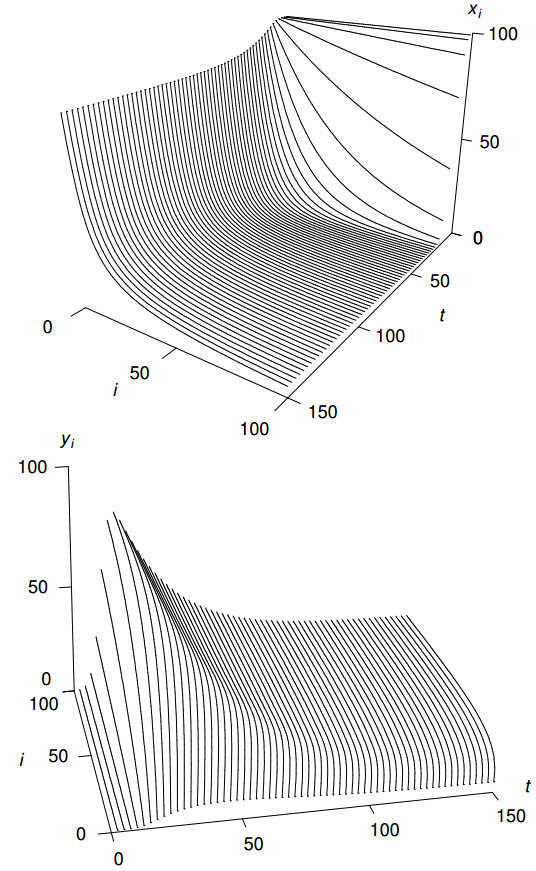
Many diseases, such as HIV, are heterogeneous for risk. In this paper, we study an infectious-disease model for a population with demography, mass-action incidence, an arbitrary number of risk classes, and separable mixing. We complement our general analyses with two specific examples. In the first example, the mean of the components of the transmission coefficients decreases as we add more risk classes. In the second example, the mean stays constant but the variance decreases. For each example, we determine the disease-free equilibrium, the basic reproduction number, and the endemic equilibrium. We also characterize the spectrum of eigenvalues that determine the stability of the endemic equilibrium. For both examples, the basic reproduction number decreases as we add more risk classes. The endemic equilibrium, when present, is asymptotically stable. Our analyses suggest that risk structure must be modeled correctly, since different risk structures, with similar mean properties, can produce different dynamics.
Citation: Mark Kot, Dobromir T. Dimitrov. The dynamics of a simple, risk-structured HIV model[J]. Mathematical Biosciences and Engineering, 2020, 17(4): 4184-4209. doi: 10.3934/mbe.2020232
Many diseases, such as HIV, are heterogeneous for risk. In this paper, we study an infectious-disease model for a population with demography, mass-action incidence, an arbitrary number of risk classes, and separable mixing. We complement our general analyses with two specific examples. In the first example, the mean of the components of the transmission coefficients decreases as we add more risk classes. In the second example, the mean stays constant but the variance decreases. For each example, we determine the disease-free equilibrium, the basic reproduction number, and the endemic equilibrium. We also characterize the spectrum of eigenvalues that determine the stability of the endemic equilibrium. For both examples, the basic reproduction number decreases as we add more risk classes. The endemic equilibrium, when present, is asymptotically stable. Our analyses suggest that risk structure must be modeled correctly, since different risk structures, with similar mean properties, can produce different dynamics.

| [1] | R. M. Grant, J. R. Lama, P. L. Anderson, V. McMahan, A. Y. Liu, L. Vargas, et al., Preexposure chemoprophylaxis for HIV prevention in men who have sex with men, N. Engl. J. Med., 363 (2010), 2587-2599. |
| [2] | J. M. Baeten, D. Donnell, P. Ndase, N. R. Mugo, J. D. Campbell, J. Wangisi, et al., Antiretroviral prophylaxis for HIV prevention in heterosexual men and women, N. Engl. J. Med., 367 (2012), 399-410. |
| [3] | M. C. Thigpen, P. M. Kebaabetswe, L. A. Paxton, D. K. Smith, C. E. Rose, T. M. Segolodi, et al., Antiretroviral preexposure prophylaxis for heterosexual HIV transmission in Botswana, N. Engl. J. Med., 367 (2012), 423-434. |
| [4] | J.-M. Molina, C. Capitant, B. Spire, G. Pialoux, L. Cotte, I. Charreau, et al., On-demand preexposure prophylaxis in men at high risk for HIV-1 infection, N. Engl. J. Med., 373 (2015), 2237-2246. |
| [5] | S. McCormack, D. T. Dunn, M. Desai, D. I. Dolling, M. Gafos, R. Gilson, et al., Pre-exposure prophylaxis to prevent the acquisition of HIV-1 infection (PROUD): Effective results from the pilot phase of a pragmatic open-label randomised trial, Lancet, 387 (2016), 53-60. |
| [6] | D. A. Margolis, J. Gonzalez-Garcia, H.-J. Stellbrink, J. J. Enron, Y. Yazdanpanah, D. Podzamczer, et al., Long-acting intramuscular cabotegravir and rilpivirine in adults with HIV-1 infection (LATTE-2): 96-week results of a randomised, open-label, phase 2b, non-inferiority trial, Lancet, 390 (2017), 1499-1510. |
| [7] |
J. Cohen, Long-acting drug acts like a short-term AIDS vaccine, Science, 368 (2020), 807. doi: 10.1126/science.368.6493.807

|
| [8] |
R. D'Amico, D. A. Margolis, Long-acting injectable therapy: An emerging paradigm for the treatment of HIV infection, Curr. Opin. HIV AIDS, 15 (2020), 13-18. doi: 10.1097/COH.0000000000000606
|
| [9] | M. Kovarova, S. R. Benhabbour, I. Massud, R. A. Spagnuolo, B. Skinner, C. E. Baker, et al., Ultralong-lasting removable drug delivery system for HIV treatment and prevention, Nat. Commun., 9 (2018), 4156. |
| [10] |
E. D. Weld, C. Flexner, Long-acting implants to treat and prevent HIV infection, Curr. Opin. HIV AIDS, 15 (2020), 33-41. doi: 10.1097/COH.0000000000000591
|
| [11] | J. Abbasi, Large HIV vaccine trial launches in South Africa, JAMA, 317 (2017), 350. |
| [12] | S. de Montigny, B. J. S. Adamson, B. R. Masse, L. P. Garrison, J. G. Kublin, P. B. Gilbert, et al., Projected effectiveness and added value of HIV vaccination campaigns in South Africa: A modeling study, Sci. Rep., 8 (2018), 6066. |
| [13] |
L. F. Johnson, P. J. White, A review of mathematical models of HIV/AIDS interventions and their implications for policy, Sex. Transm. Infect., 87 (2011), 629-634. doi: 10.1136/sti.2010.045500
|
| [14] | J. W. Eaton, N. A. Menzies, J. Stover, V. Cambiano, L. Chindelevitch, A. Cori, et al., Health benefits, costs, and cost-effectiveness of earlier eligibility for adult antiretroviral therapy and expanded treatment coverage: A combined analysis of 12 mathematical models, Lancet Global Health, 2 (2013), e23-e34. |
| [15] |
R. M. Anderson, G. F. Medley, R. M. May, A. M. Johnson, A preliminary study of the transmission dynamics of the human immunodeficiency virus (HIV), the causitive agent of AIDS, IMA J. Math. Appl. Med. Biol., 3 (1986), 229-263. doi: 10.1093/imammb/3.4.229
|
| [16] |
G. P. Garnett, R. M. Anderson, Factors controlling the spread of HIV in heterosexual communities in developing countries: Patterns of mixing between different age and sexual activity classes, Philos. Trans. R. Soc. B, 342 (1993), 137-159. doi: 10.1098/rstb.1993.0143
|
| [17] |
N. J. D. Nagelkerke, S. J. de Vlas, P. Jha, M. Luo, F. A. Plummer, R. Kaul, Heterogeneity in host HIV susceptibility as a potential contributor to recent HIV prevalence declines in Africa, AIDS, 23 (2009), 125-130. doi: 10.1097/QAD.0b013e3283177f20
|
| [18] | G. Rozhnova, M. F. S. vand der Loeff, J. C. M. Heijne, M. E. Kretzschmar, Impact of heterogeneity in sexual behavior on effectiveness in reducing HIV transmission with test-and-treat strategy, PLoS Comp. Biol., 12 (2016), e1005012. |
| [19] | M. J. Keeling, P. Rohani, Modeling Infectious Diseases in Humans and Animals, Princeton University Press, Princeton, 2008. |
| [20] |
J. A. Jacquez, C. P. Simon, J. Koopman, L. Sattenspiel, T. Perry, Modeling and analyzing HIV transmission: the effect of contact patterns, Math. Biosci., 92 (1988), 119-199. doi: 10.1016/0025-5564(88)90031-4
|
| [21] |
J. M. Hyman, E. A. Stanley, Using mathematical models to understand the AIDS epidemic, Math. Biosci., 90 (1988), 415-473. doi: 10.1016/0025-5564(88)90078-8
|
| [22] | A. Azizi, K. Rios-Soto, A. Mubayi, J. M. Hyman, A risk-based model for predicting the impact of using condoms on the spread of sexually transmitted infections, Infect. Dis. Model., 2 (2017), 100-112. |
| [23] | S. Busenberg, C. Castillo-Chavez, A general solution of the problem of mixing of subpopulations and its application to risk- and age-structured epidemic models for the spread of AIDS, IMA J. Math. Appl. Med. Biol., 8 (1991), 1-29. |
| [24] | O. Diekmann, H. Heesterbeek, T. Britton, Mathematical Tools for Understanding Infectious Disease Dynamics, Princeton University Press, Princeton, 2013. |
| [25] |
D. Juher, J. Ripoll, J. Saldana, Analysis and Monte Carlo simulations of a model for the spread of infectious diseases in heterogeneous metapopulations, Phys. Rev. E, 80 (2009), 041920. doi: 10.1103/PhysRevE.80.041920
|
| [26] |
N. Masuda, Effects of diffusion rates on epidemic spreads in metapopulation networks, New J. Phys., 12 (2010), 093009. doi: 10.1088/1367-2630/12/9/093009
|
| [27] |
G. Tanaka, C. Urabe, K. Aihara, Random and targeted interventions for epidemic control in metapopulation models, Sci. Rep., 4 (2015), 5522. doi: 10.1038/srep05522
|
| [28] |
M. Liu, J. Zhang, Z. Li, Y. Sun, Modeling epidemic in metapopulation networks with heterogeneous diffusion rates, Math. Biosci. Eng., 16 (2019), 7085-7097. doi: 10.3934/mbe.2019355
|
| [29] |
Y. Xiao, S. Tang, Y. Zhou, R. J. Smith, J. Wu, N. Wang, Predicting the HIV/AIDS epidemic and measuring the effect of mobility in mainland China, J. Theor. Biol., 317 (2013), 271-285. doi: 10.1016/j.jtbi.2012.09.037
|
| [30] | A. Isdory, E. Moreithi, D. J. T. Sumpter, The impact of human mobility on HIV transmission in Kenya, PLoS One, 10 (2015), e0142805. |
| [31] |
G. Chowell, L. Sattenspiel, S. Bansal, C. Viboud, Mathematical models to characterize early epidemic growth: a review, Phys. Life Rev., 18 (2016), 66-97. doi: 10.1016/j.plrev.2016.07.005
|
| [32] | A. C. Pipkin, A Course on Integral Equations, Springer-Verlag, New York, 1991. |
| [33] | R. P. Kanwal, Linear Integral Equations, Birkhauser, Boston, 1997. |
| [34] | L. Sattenspiel, The Geographic Spread of Infectious Diseases: Models and Applications, Princeton University Press, Princeton, 2009. |
| [35] | J. V. Uspensky, Theory of Equations, McGraw-Hill Book Company, New York, 1948. |
| [36] | J. H. Wilkinson, C. Reinsch, Handbook for Automatic Computation: Volume II: Linear Algebra, Springer-Verlag, Berlin, 1971. |
| [37] | W. H. Press, S. A. Teukolsky, W. T. Vetterling, B. P. Flannery, Numerical Recipes in C: The Art of Scientific Computing, Cambridge University Press, Cambridge, 1997. |
| [38] |
M.-C. Boily, R. Poulin, B. Masse, Some methodological issues in the study of sexual networks: from model to data to model, Sex. Transm. Dis., 27 (2000), 558-571. doi: 10.1097/00007435-200011000-00004
|
| [39] | F. Liljeros, C. R. Edling, L. A. Nunes Amaral, Sexual networks: implications for the transmission of sexually transmitted infections, Microbes Infect., 5 (2003), 189-196. |
| [40] | J. L. Marcus, L. B. Hurley, D. S. Krakower, S. Alexeeff, M. J. Silverberg, J. E. Volk, Use of electronic health record data and machine learning to identify candidates for HIV pre-exposure prophylaxis: A modeling study, Lancet HIV, 6 (2019), e688-e695. |
| [41] | W. O. Kermack, A. G. McKendrick, A contribution to the mathematical theory of epidemics., Proc. R. Soc. A, 115 (1927), 700-721. |
| [42] |
R. M. Anderson, Discussion: The Kermack-McKendrick epidemic threshold theorem, Bull. Math. Biol., 53 (1991), 3-32. doi: 10.1016/S0092-8240(05)80039-4
|
| [43] | J. O. Lloyd-Smith, P. C. Cross, C. J. Briggs, M. Daugherty, W. M. Getz, J. Latto, et al., Should we expect population thresholds for worldlife disease?, Trends Ecol. Evol., 20 (2005), 511-519. |
| [44] |
M. G. Neubert, H. Caswell, Alternatives to resilience for measuring the responses of ecological systems to perturbations, Ecology, 78 (1997), 653-665. doi: 10.1890/0012-9658(1997)078[0653:ATRFMT]2.0.CO;2
|
| [45] | M. G. Neubert, T. Klanjscek, H. Caswell, Reactivity and transient dynamics of predator-prey and food web models, Ecol. Modell., 179 (2004), 23-38. |
| [46] | L. N. Trefethen, M. Embree, Spectra and Pseudospectra: The Behavior of Nonnormal Matrices and Operators, Princeton University Press, Princeton, 2005. |
| [47] | S. P. Ellner, D. Z. Childs, M. Rees, Data-Driven Modelling of Structured Populations: A Practical Guide to the Integral Projection Model, Springer, Cham, Switzerland, 2016. |


Figures(8) / Tables(2)

Mark Kot, Dobromir T. Dimitrov. The dynamics of a simple, risk-structured HIV model[J]. Mathematical Biosciences and Engineering, 2020, 17(4): 4184-4209. doi: 10.3934/mbe.2020232


 DownLoad: